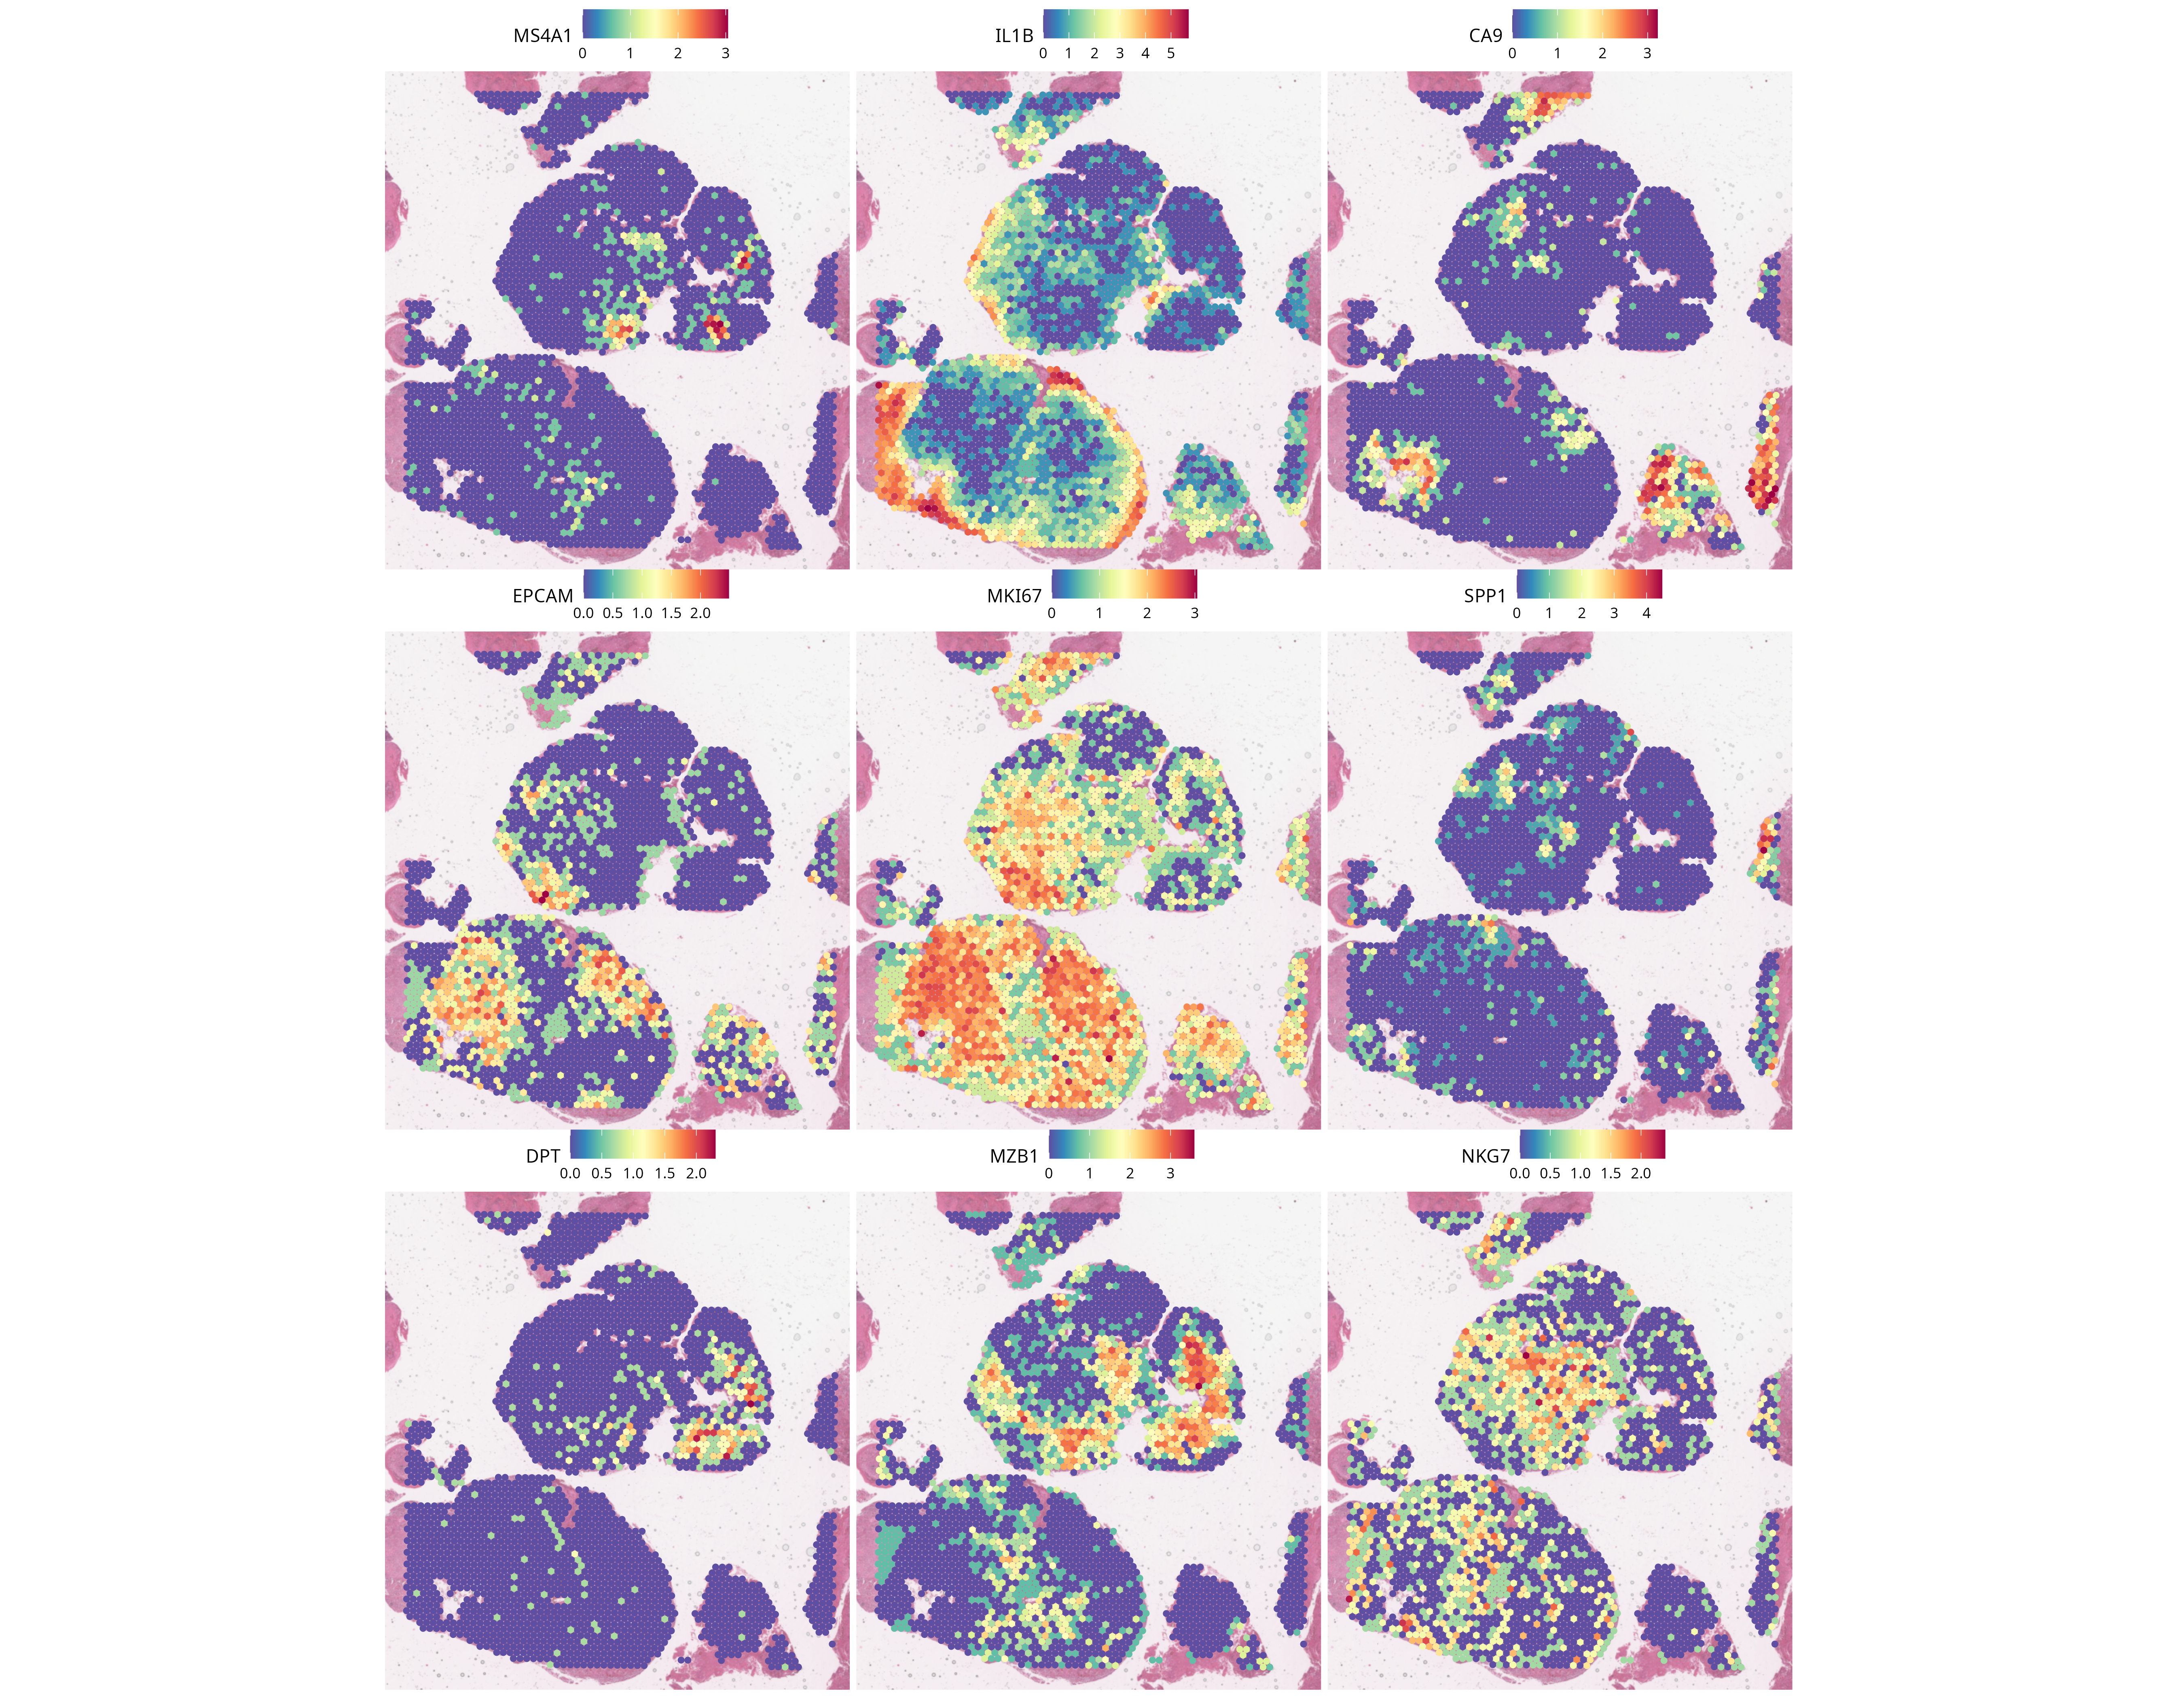
Spatial Organization of Malignant and Immune Compartments in Two HNSCC Tissue Sections
Executive summary
This portfolio project asks: How are malignant and immune compartments spatially organized across two HNSCC tissue sections? Two 10x Genomics Visium samples, 17B5776 and 19H1257, were processed independently, compared in a joint Seurat representation and deconvolved with SpaCET. The workflow combines spot-level quality control, SCTransform normalization, graph-based clustering, reciprocal PCA (RPCA) integration, marker-guided interpretation and spatial deconvolution.
The analysis identifies heterogeneous transcriptional domains within the tissue sections and estimates spatial variation in malignant, stromal and immune contributions. In the saved SpaCET summaries, 19H1257 has a higher median estimated malignant fraction than 17B5776, whereas 17B5776 has a higher median derived immune fraction. These are observations from two sections, not population-level effects. Immune-high spots in both samples contain mixed immune signals, with neutrophils providing the largest mean relative share in the saved composition table.
The study contains only two biological samples. All cross-sample comparisons are descriptive, and spots from the same section are spatially correlated rather than independent biological replicates. SpaCET estimates transcriptional cell fractions, not exact cell counts. The current analysis characterizes malignant fractions and immune niches, but it does not formally identify distinct malignant transcriptional states; that component of the broader biological motivation remains unresolved.
Biological background
Head and neck squamous cell carcinoma (HNSCC) tissues contain malignant epithelial, stromal, vascular and immune compartments arranged within a spatially heterogeneous microenvironment. Bulk expression measurements average these signals, while standard Visium data retain their tissue coordinates. A Visium spot can contain multiple cells, so spot-level expression represents a local mixture rather than a single-cell profile.
Spatial transcriptomics can therefore be used to describe where transcriptional programs and estimated cellular compartments occur within a section. It cannot, by itself, establish direct cell–cell interaction, migration, clinical response or causal biological mechanisms.
Biological question
The current, analysis-supported question is:
How are malignant and immune compartments spatially organized across two HNSCC tissue sections?
This formulation deliberately separates what was measured from what remains to be tested. SpaCET provides estimates of malignant and immune contributions, and the quartile analysis locates sample-relative immune niches. A formal analysis of distinct malignant transcriptional states was not performed and should not be inferred from malignant-fraction maps or epithelial cluster markers.
Dataset and project scope
The project contains two biological HNSCC Visium samples:
| Sample | Sample-level workflow | Working clustering resolution |
|---|---|---|
| 17B5776 | Quality control, SCTransform, PCA/UMAP, graph clustering and marker assessment | 0.6 |
| 19H1257 | Quality control, SCTransform, PCA/UMAP, graph clustering and marker assessment | 0.8 |
The inputs were filtered Space Ranger expression matrices, tissue images and spatial coordinates. The report reuses saved tables and figures from results/; it does not rerun SCTransform, integration, marker calculations or SpaCET deconvolution.
The unit of observation is the Visium spot. A spot may contain several cells. Consequently, clusters are described as transcriptionally enriched spatial domains, and SpaCET results are described as estimated transcriptional fractions.
Computational workflow
The project follows five linked stages:
- Import each Space Ranger dataset into Seurat and inspect transcript, feature and mitochondrial quality metrics in tissue space.
- Apply the existing spot- and gene-level filters, normalize retained expression with SCTransform, and build PCA, neighbor-graph and UMAP representations.
- Evaluate clustering resolutions within each sample and interpret selected domains using differential-expression results, canonical markers and spatial localization.
- Merge the sample objects, generate a joint PCA representation and apply RPCA integration for descriptive joint clustering.
- Use SpaCET with the HNSC cancer model to estimate malignant, stromal and immune lineage fractions; then derive sample-relative immune niches and summarize their major immune-lineage composition.
Fixed random seeds were used for UMAP and clustering where specified in the notebooks. The saved result tables provide the numerical source for the compartment and immune-niche summaries below.
Sample-level quality control
Sample 17B5776
The notebook reports 2,582 initial spots and 2,517 retained spots after applying the existing criteria of more than 200 detected genes and less than 10% mitochondrial transcripts. Sixty-five spots were removed. The documented spatial inspection places most excluded spots in a restricted lower-tissue region associated with elevated mitochondrial signal. After spot filtering, genes detected in fewer than three retained spots were removed.
Observation. Transcript counts, detected genes and mitochondrial percentages varied spatially, and the excluded spots were not uniformly distributed.
Interpretation. Spatially localized low-complexity or high-mitochondrial signal may reflect technical degradation, local tissue condition or both. The QC metrics alone do not identify the cause.
Sample 19H1257
The notebook reports 2,216 initial spots. Only one spot met the low-feature exclusion criterion, and no spot exceeded the 10% mitochondrial threshold. Low-feature spots identified during exploratory assessment were concentrated mainly near tissue boundaries.
Observation. Spot-level filtering had a minimal effect on this section under the selected thresholds.
Interpretation. The retained section has broadly high transcriptomic complexity under these metrics, but this does not guarantee uniform RNA quality or tissue composition.
Individual sample clustering
Both samples were normalized with SCTransform and represented by PCA. The first 15 principal components were used to build transcriptional neighbor graphs and UMAP embeddings; tissue coordinates were not used for graph construction or clustering.
For 17B5776, resolution 0.6 was selected as the working solution. The notebook documents a split of a resolution-0.4 parent cluster into an immune-enriched domain and a hypoxic/inflammatory epithelial domain at resolution 0.6. Marker-guided annotations across the final clusters describe B-cell-associated, myeloid, epithelial, stromal, hypoxic, interferon-responsive and proliferative programs. These labels are provisional descriptions of mixed spots, not purified cell types.
For 19H1257, resolution 0.8 was selected after comparison with resolution 0.6. The notebook reports that the finer solution primarily subdivided two clusters and that the resulting groups showed distinct marker profiles. No saved sample-19 marker or cluster figure is available in results/figures, so this report does not reproduce those visualizations.
Methodological caution. UMAP and graph clustering share the same PCA-derived neighborhood information and are not independent validations of one another. Marker tests compare spots within a section and do not supply patient-level replication.
Cross-sample integration
The sample-specific objects were merged, and their variable features were combined for a joint PCA. A non-integrated UMAP retained both biological and technical sources of between-sample variation. RPCA integration was then used to align comparable expression profiles and construct an integrated neighbor graph, UMAP and resolution-0.6 joint clustering.
Observation. The notebook reports that most integrated clusters contained spots from both samples, while several clusters were enriched in one sample. The spatial projection of integrated labels formed structured domains in both tissue sections.
Interpretation. Shared clusters are consistent with recurrent transcriptional programs, whereas sample-enriched clusters may reflect biological heterogeneity, differences in sampled tissue composition, technical effects or incomplete integration.
Limitation. Integration can leave residual technical structure or reduce genuine sample-specific biology. With only two samples, cluster composition cannot be interpreted as prevalence across HNSCC patients. No saved integrated UMAP or spatial-cluster figure is present in results/figures; the corresponding evidence remains in notebook 03.
Spatial cell-type deconvolution with SpaCET
SpaCET was applied independently to each quality-controlled Visium count matrix using the HNSC cancer model. The method uses cancer and cell-lineage expression signatures to estimate malignant, stromal and immune transcriptional contributions to each mixed spot.
SpaCET outputs are estimated transcriptional fractions, not exact cell counts. Estimates depend on the reference signatures, RNA content, tissue context and model assumptions. A high estimated fraction indicates a larger contribution to the spot-level expression mixture; it does not directly report the number of cells of that type.
The comparative table retained the following major SpaCET categories: Malignant, CAF, Endothelial, Plasma, B cell, T CD4, T CD8, NK, cDC, pDC, Macrophage, Mast, Neutrophil and Unidentifiable. Major and subordinate SpaCET hierarchy levels were not added together because they are overlapping representations and would be double-counted.
Comparison of major cellular compartments
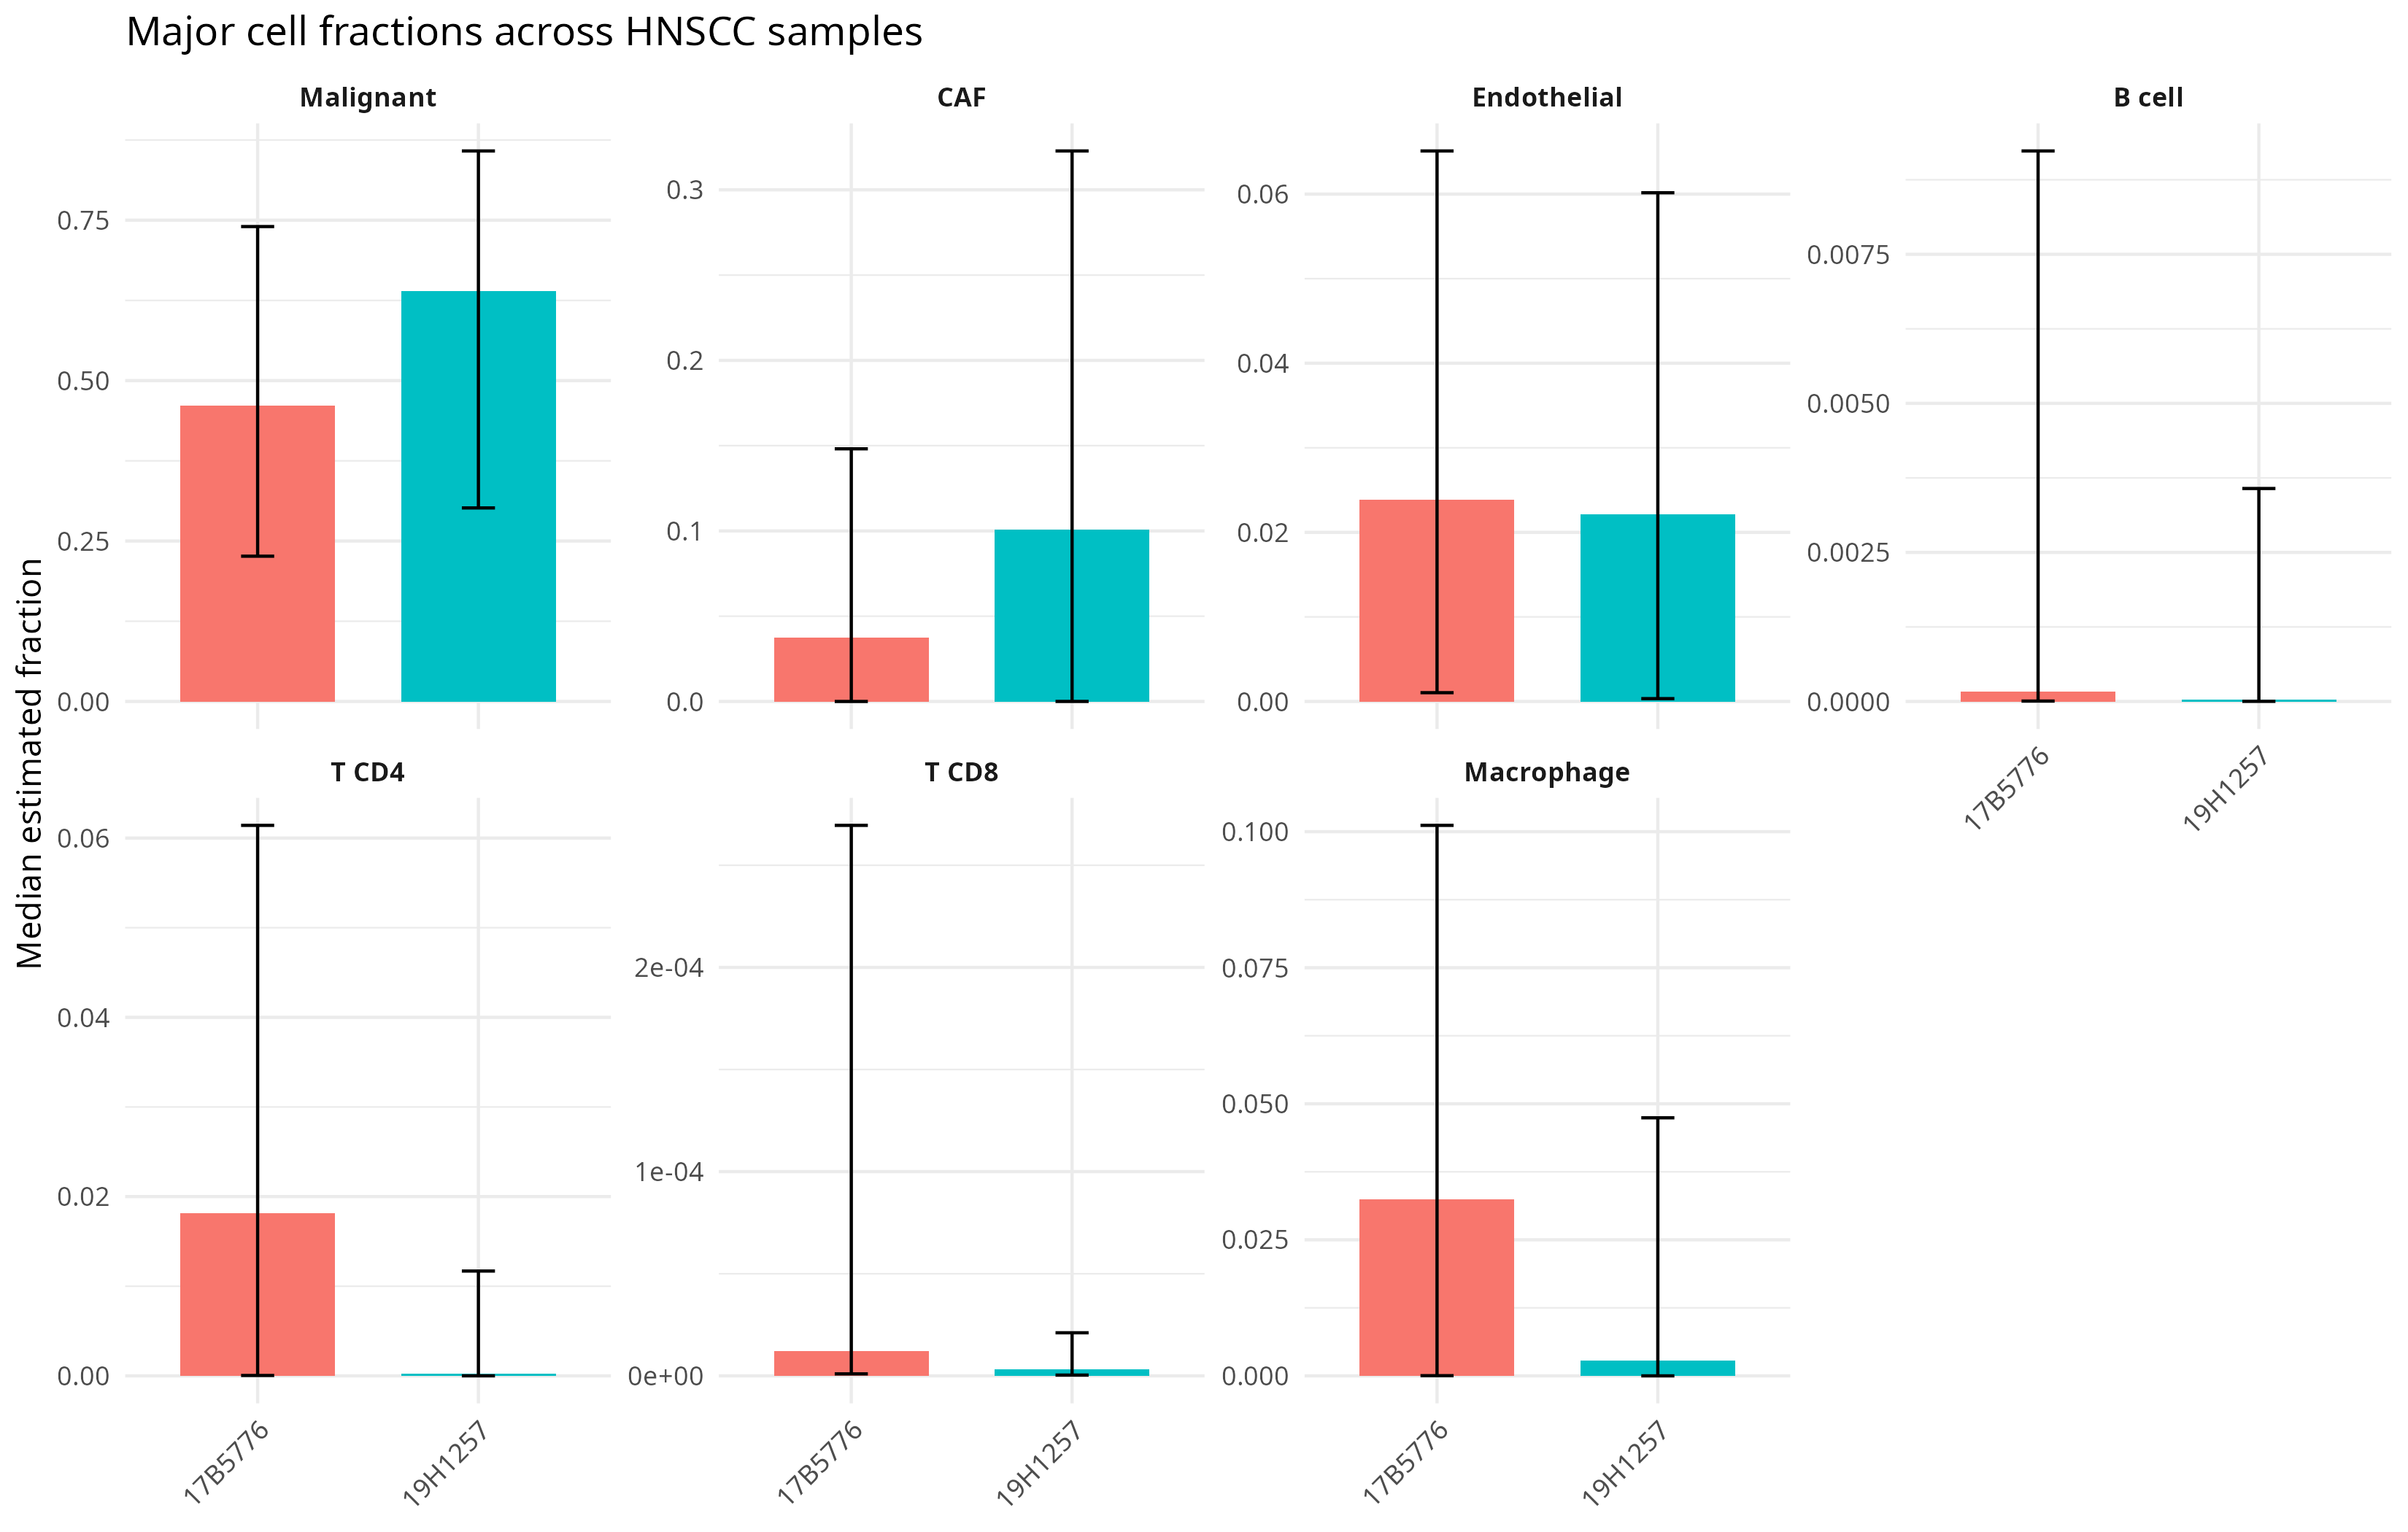
The saved compartment summary reports the mean, median and interquartile range of each estimated fraction across spots in each sample. The plot displays selected compartments using the spot-level median and first-to-third-quartile interval.
| Sample | Compartment | Median | Q1 | Q3 | |
|---|---|---|---|---|---|
| 1 | 17B5776 | Malignant | 0.461 | 0.226 | 0.740 |
| 2 | 17B5776 | CAF | 0.038 | 0.000 | 0.148 |
| 3 | 17B5776 | Endothelial | 0.024 | 0.001 | 0.065 |
| 5 | 17B5776 | B cell | 0.000 | 0.000 | 0.009 |
| 6 | 17B5776 | T CD4 | 0.018 | 0.000 | 0.061 |
| 7 | 17B5776 | T CD8 | 0.000 | 0.000 | 0.000 |
| 11 | 17B5776 | Macrophage | 0.033 | 0.000 | 0.101 |
| 15 | 19H1257 | Malignant | 0.639 | 0.302 | 0.858 |
| 16 | 19H1257 | CAF | 0.101 | 0.000 | 0.323 |
| 17 | 19H1257 | Endothelial | 0.022 | 0.000 | 0.060 |
| 19 | 19H1257 | B cell | 0.000 | 0.000 | 0.004 |
| 20 | 19H1257 | T CD4 | 0.000 | 0.000 | 0.012 |
| 21 | 19H1257 | T CD8 | 0.000 | 0.000 | 0.000 |
| 25 | 19H1257 | Macrophage | 0.003 | 0.000 | 0.047 |
Observation. The saved table shows a higher median estimated malignant fraction in 19H1257 than in 17B5776. It also shows a higher median CAF fraction in 19H1257, while the median endothelial fractions are similar in magnitude.
Interpretation. These differences describe the two sampled sections. They may reflect tissue composition, spatial sampling and model behavior and cannot be generalized as patient-group differences.
Spatial immune niche analysis
Derived total immune fraction
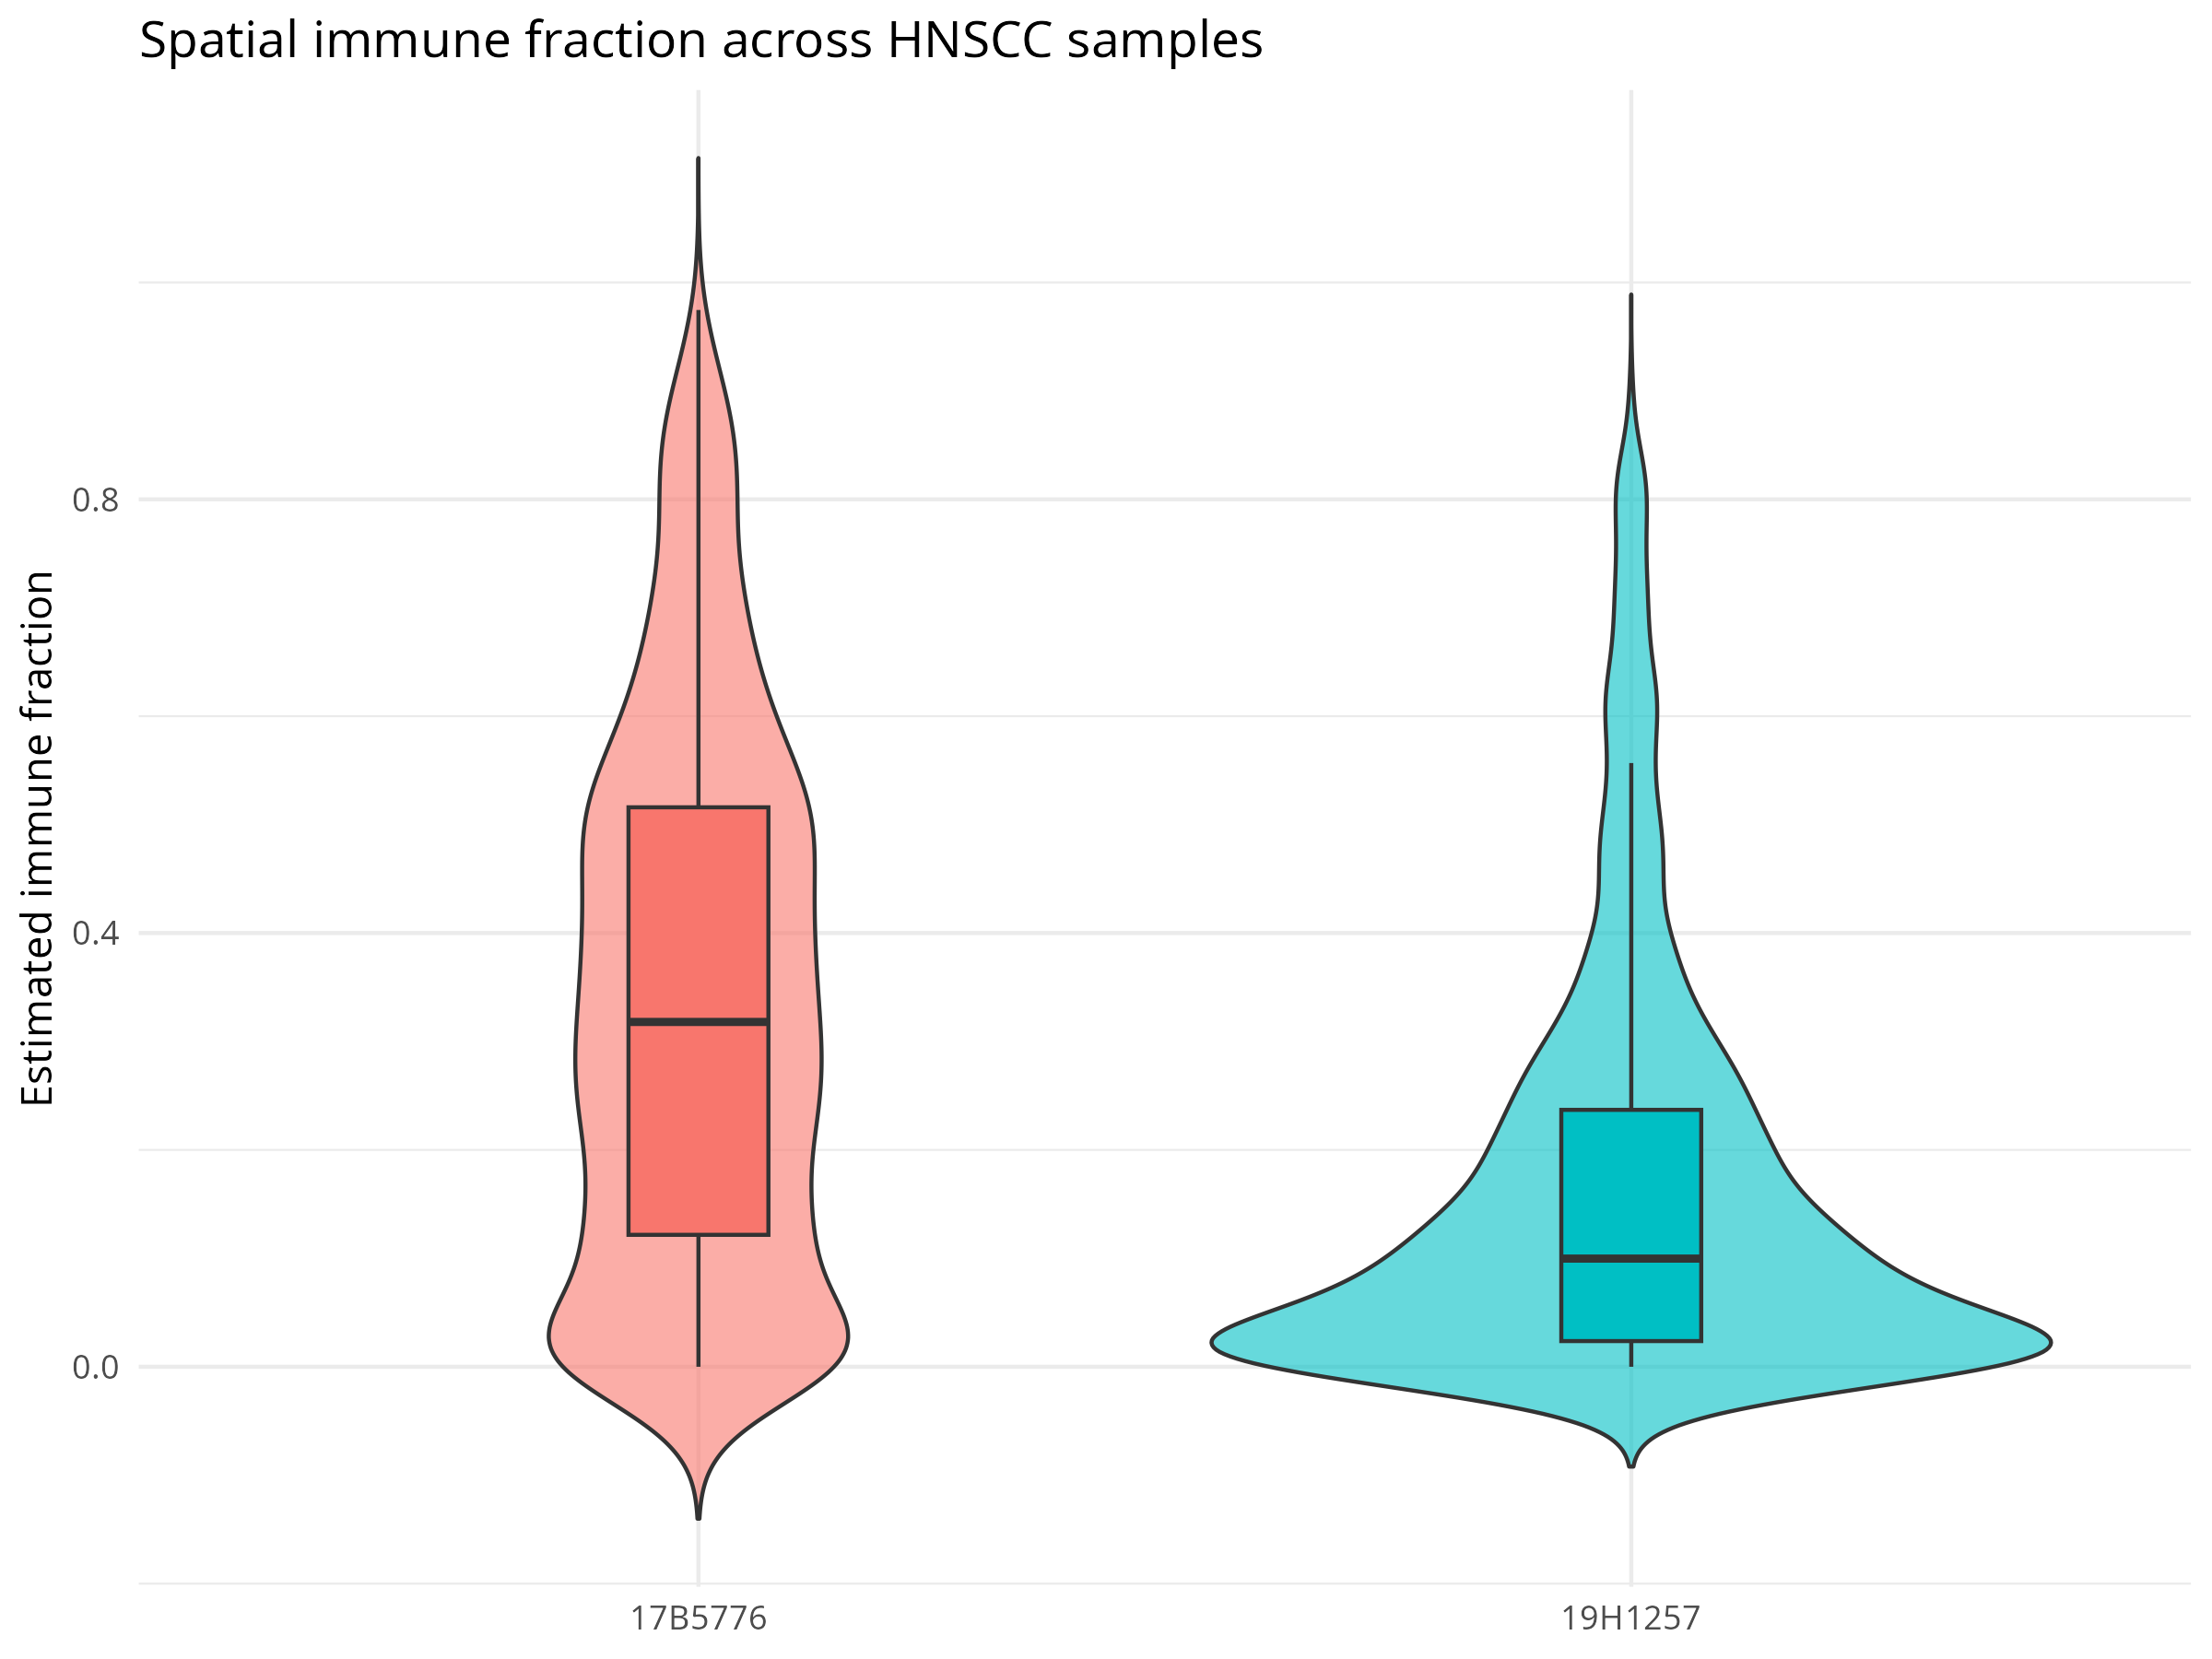
The total immune fraction was calculated for every spot by summing only the major immune lineage estimates: Plasma, B cell, T CD4, T CD8, NK, cDC, pDC, Macrophage, Mast and Neutrophil. Subordinate SpaCET categories were excluded to avoid double-counting parent and child hierarchy levels. This sum is a derived immune estimate, not an independently fitted cell count.
| Sample | Median | Q1 | Q3 |
|---|---|---|---|
| 17B5776 | 0.318 | 0.122 | 0.516 |
| 19H1257 | 0.100 | 0.024 | 0.237 |
Observation. The median derived immune fraction is higher in 17B5776 than in 19H1257 in the saved summary. Both sections contain substantial within-section variation.
Sample-relative immune categories
Immune status was defined independently within each tissue section. Spots at or below the sample-specific first quartile of total immune fraction were labelled Immune-low, spots at or above the third quartile were labelled Immune-high, and the remaining spots were labelled Intermediate.
These categories are relative within each section. An Immune-high spot in 17B5776 is not necessarily equivalent in absolute immune fraction to an Immune-high spot in 19H1257. The labels are not universal biological thresholds and have no clinical interpretation.
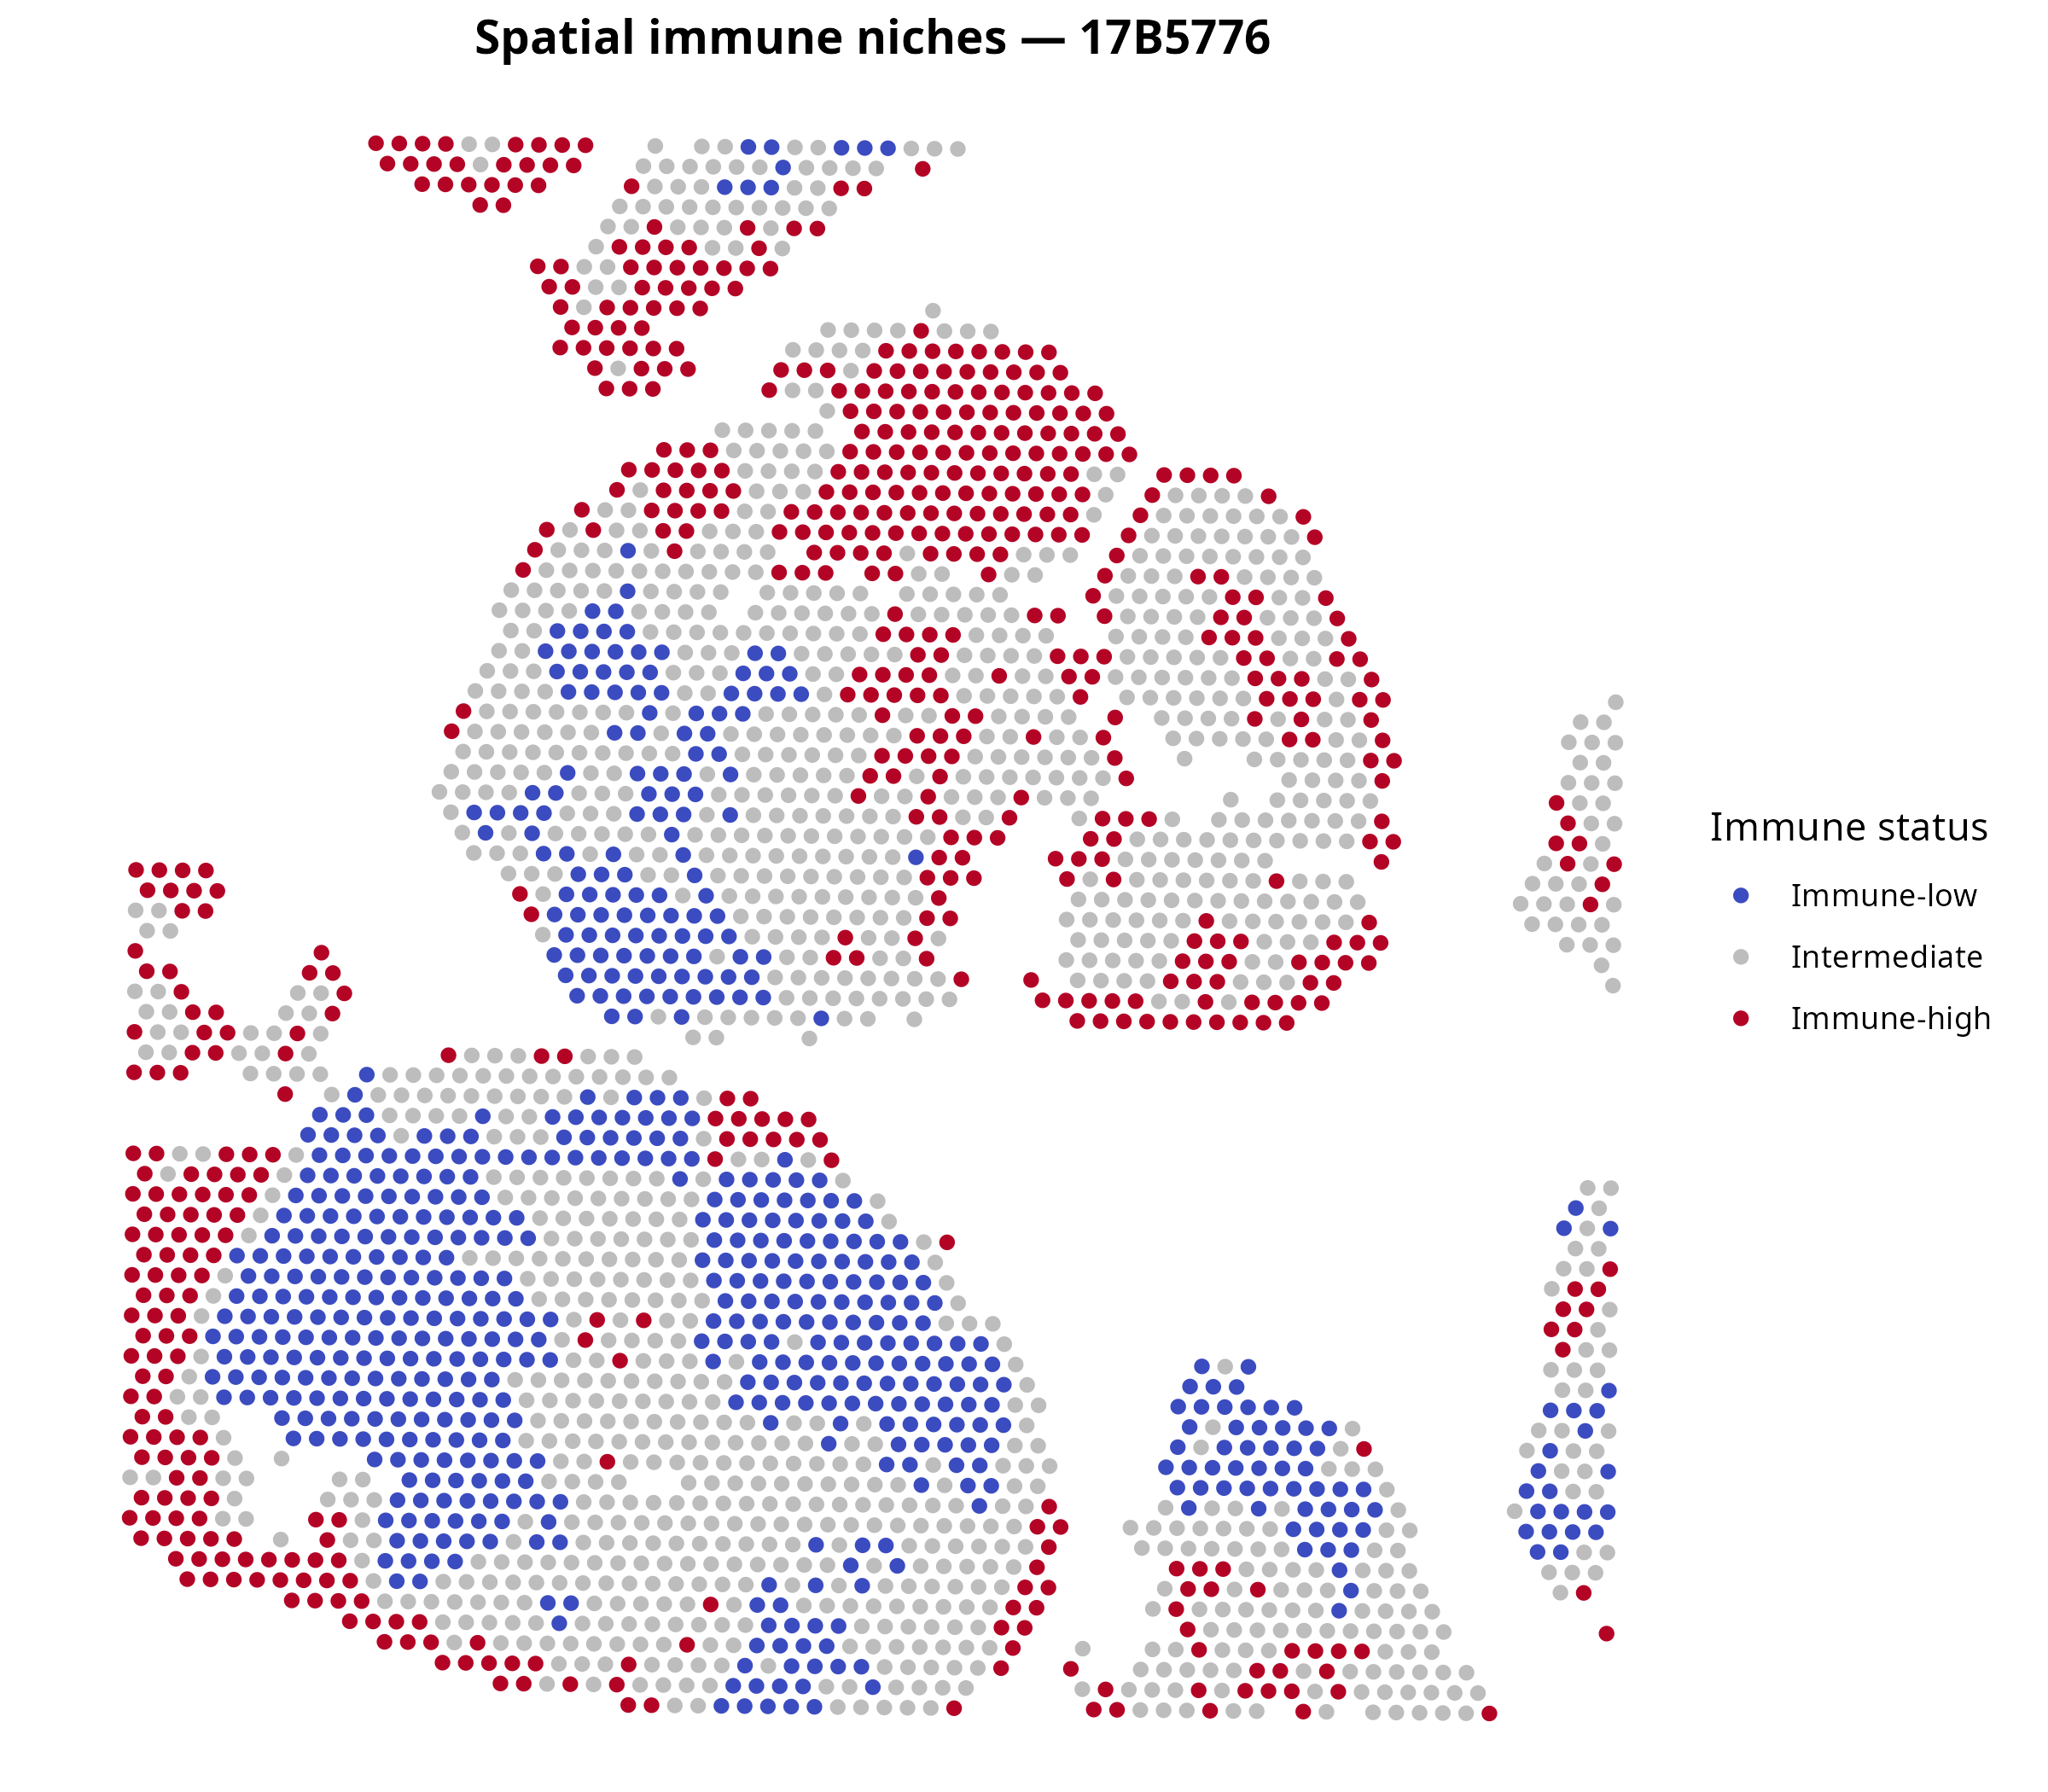
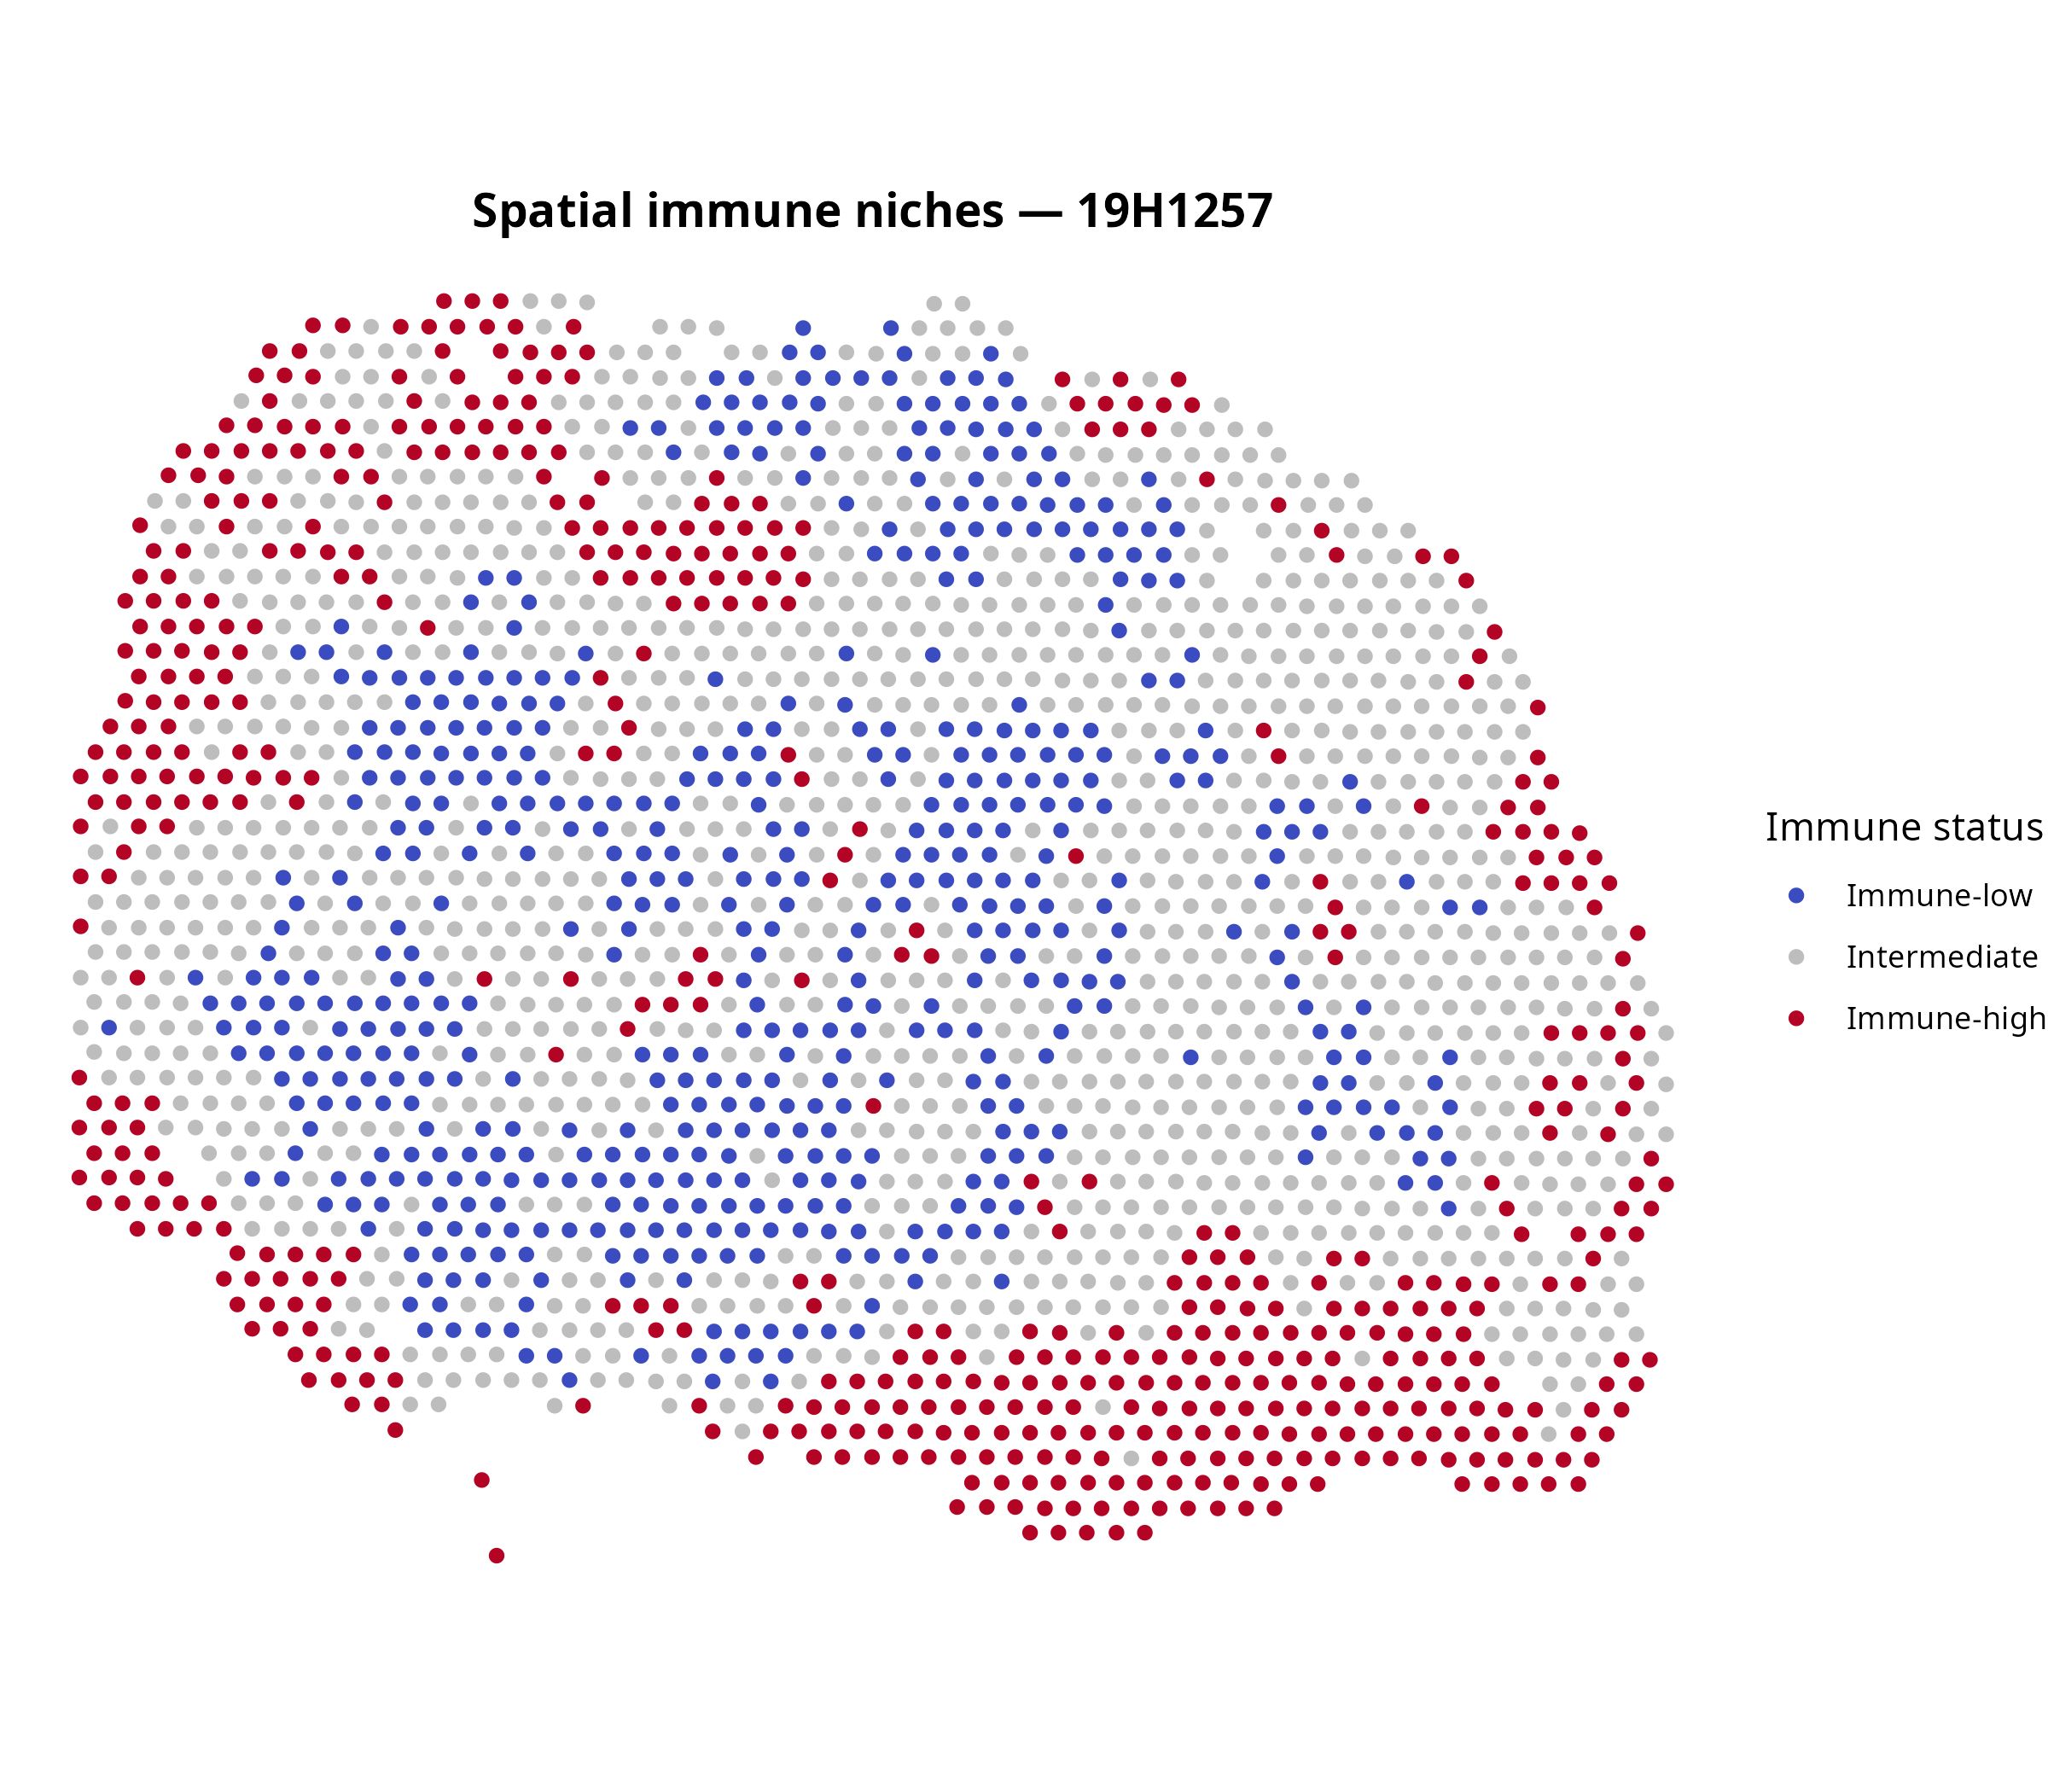
Observation. The saved maps show that Immune-high, Intermediate and Immune-low spots are spatially distributed across each section rather than represented by a single section-wide value.
Interpretation. Local aggregation is consistent with spatial heterogeneity in immune transcriptional contribution. The maps do not establish physical interaction, immune-cell function or movement.
Relative composition of Immune-high niches
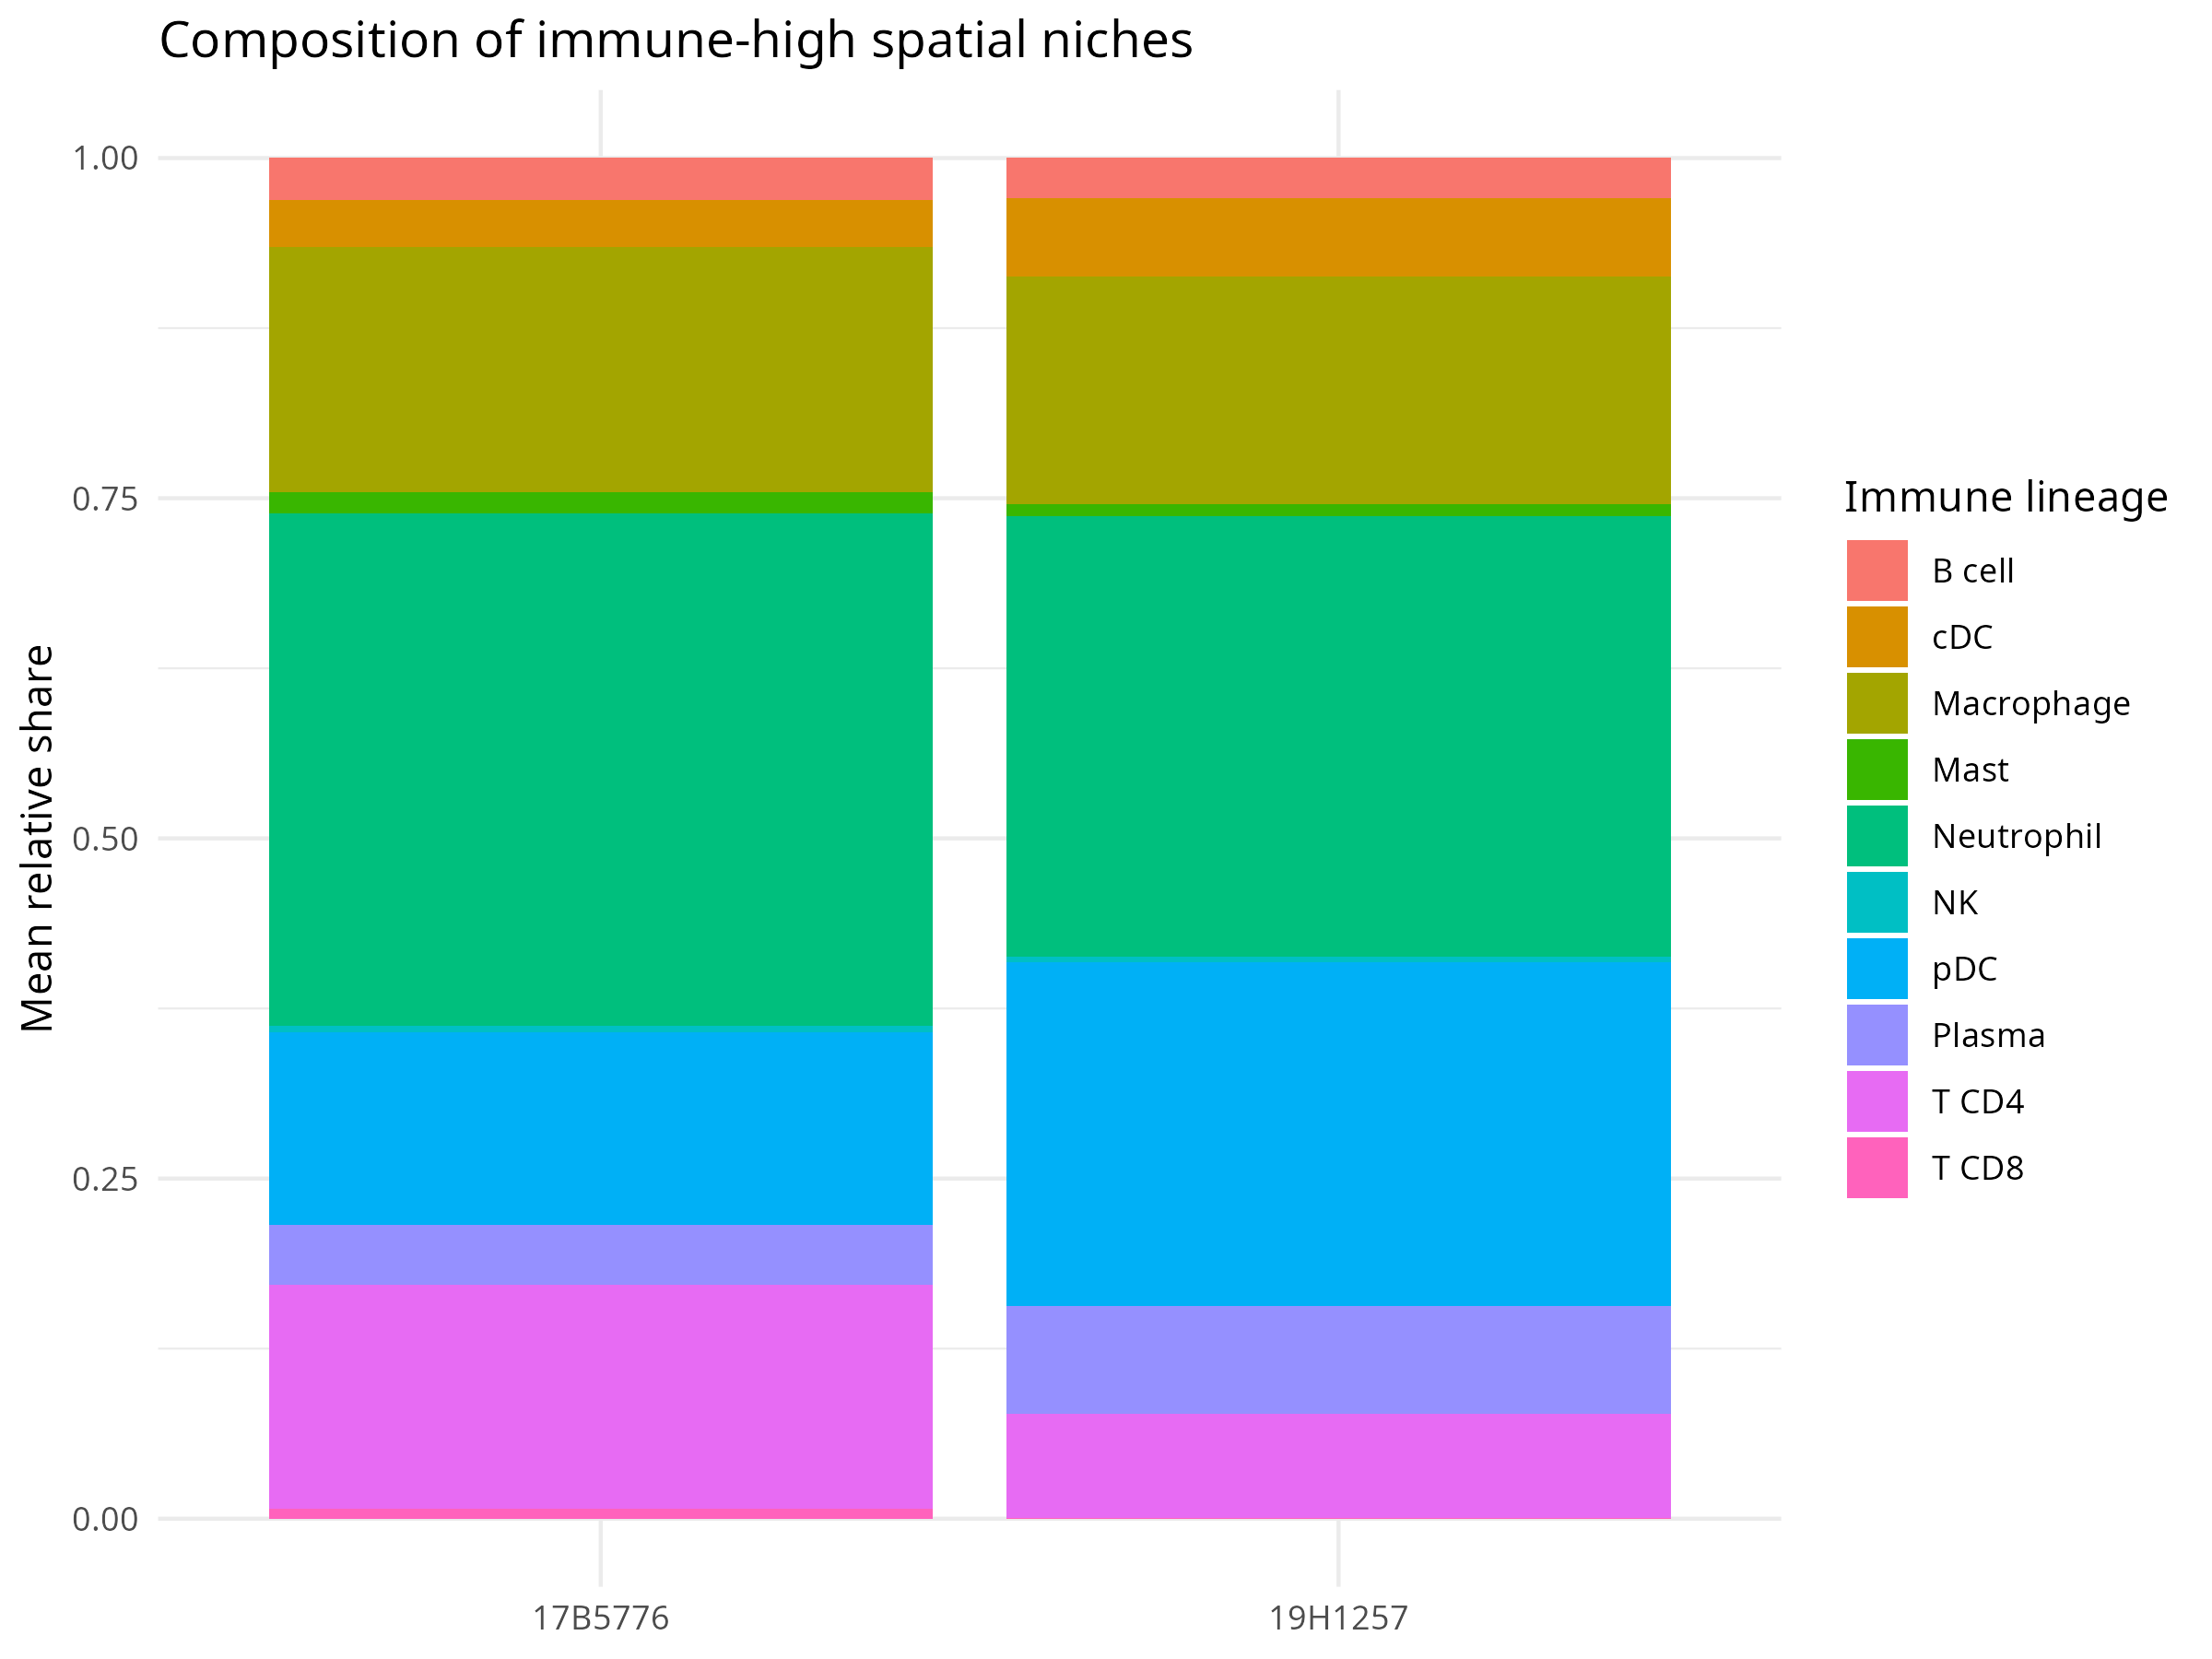
For each Immune-high spot, each major immune-lineage estimate was divided by that spot’s total immune fraction. These within-immune shares were then averaged separately by sample. A larger share indicates a larger contribution to the estimated immune signal, not a higher absolute fraction or a larger cell count.
| Sample | Immune lineage | Mean relative share (%) |
|---|---|---|
| 17B5776 | Neutrophil | 37.7 |
| 17B5776 | Macrophage | 18.0 |
| 17B5776 | T CD4 | 16.4 |
| 17B5776 | pDC | 14.1 |
| 17B5776 | Plasma | 4.4 |
| 17B5776 | cDC | 3.4 |
| 17B5776 | B cell | 3.1 |
| 17B5776 | Mast | 1.5 |
| 17B5776 | T CD8 | 0.8 |
| 17B5776 | NK | 0.5 |
| 19H1257 | Neutrophil | 32.4 |
| 19H1257 | pDC | 25.3 |
| 19H1257 | Macrophage | 16.7 |
| 19H1257 | Plasma | 7.9 |
| 19H1257 | T CD4 | 7.7 |
| 19H1257 | cDC | 5.7 |
| 19H1257 | B cell | 3.0 |
| 19H1257 | Mast | 0.9 |
| 19H1257 | NK | 0.4 |
| 19H1257 | T CD8 | 0.1 |
Observation. Neutrophils have the largest mean relative share in Immune-high spots in both saved sample summaries. Macrophage, T CD4 and pDC signals also contribute materially in 17B5776; pDC and macrophage signals are the next largest shares in 19H1257.
Interpretation. Immune-high niches contain mixed lineage-associated transcriptional signals. Relative composition is compositional: an increase in one share necessarily changes the others, and it does not demonstrate enrichment relative to Immune-low spots.
Main biological observations
The analysis supports the following descriptive observations:
- Both HNSCC sections contain spatially structured transcriptional heterogeneity at the Visium-spot level.
- Sample 17B5776 contains marker-associated domains consistent with immune, epithelial, stromal, hypoxic, inflammatory, interferon-responsive and proliferative programs. These are provisional mixed-domain annotations.
- Integrated clustering identifies both shared and sample-enriched transcriptional domains, while retaining spatially structured patterns in each tissue section.
- SpaCET estimates heterogeneous malignant, stromal and immune contributions across spots. The saved summaries show section-level differences in median malignant and derived immune fractions.
- Sample-relative Immune-high spots contain mixed immune-lineage signals, with neutrophils contributing the largest mean relative share in both saved composition summaries.
The following interpretation is plausible but not demonstrated: differences in immune-niche organization may reflect distinct local tumor-microenvironment architectures. Testing that hypothesis would require additional biological samples, histological validation and analyses designed for replicated spatial inference.
The analysis does not formally identify distinct malignant transcriptional states. Estimated malignant fractions and epithelial marker patterns should not be presented as a completed malignant-state analysis.
Methodological limitations
- Only two biological samples are included. Cross-sample comparisons are descriptive and cannot support population-level, clinical or therapeutic claims.
- Visium spots may contain multiple cells. Cluster labels and marker patterns represent mixed spatial domains rather than pure cell types.
- Spots from the same tissue section are spatially correlated and are not independent biological replicates.
- Quality-control thresholds may remove true low-complexity tissue as well as technical failures.
- SCTransform, PCA, UMAP and graph-clustering choices influence the resulting representation and cluster granularity.
- UMAP and clustering use related PCA-derived information; agreement between them is not independent validation.
- RPCA integration may retain technical differences or attenuate real sample-specific biology.
- Marker-based annotation relies on curated genes that may be shared across lineages or biological states.
- SpaCET estimates transcriptional fractions rather than exact cell counts. Results depend on reference signatures and deconvolution assumptions.
- Major and subordinate SpaCET lineages overlap hierarchically and must not be added together.
- Immune-high and Immune-low labels use sample-specific quartiles and are relative within each section, not common absolute thresholds.
- Relative immune-lineage shares are compositional and do not measure absolute abundance or enrichment against another niche class.
- Distinct malignant transcriptional states were not formally identified in the current workflow.
Conclusion
This project provides a reproducible, spatially resolved description of malignant and immune compartment organization in two HNSCC tissue sections. Sample-level clustering captures heterogeneous transcriptional domains, joint integration highlights shared and sample-associated structure, and SpaCET provides spot-level estimates of malignant, stromal and immune contributions. The quartile-based niche analysis maps relative immune-high and immune-low regions and summarizes the mixed immune composition of Immune-high spots.
The findings are appropriately viewed as a two-sample exploratory analysis. They demonstrate an end-to-end spatial transcriptomics workflow and generate hypotheses about local immune organization, but they do not establish population-level differences, clinical implications or distinct malignant transcriptional states.
Reproducibility and software environment
The analysis is organized as four sequential notebooks:
notebooks/01_exploration_17B5776.Rmdnotebooks/02_exploration_19H1257.Rmdnotebooks/03_cross_sample_comparison.Rmdnotebooks/04_spacet_deconvolution.Rmd
Project-relative paths are managed with here. The workflows use Seurat for spatial expression analysis and integration, SpaCET for deconvolution, and packages including ggplot2, dplyr, tidyr, tibble, patchwork and clustree for data handling and visualization. Exact R and package versions are not reported in the notebooks or saved result tables and should be added only after manual verification of the environment used to generate the analyses.
This report reads existing CSV files and embeds existing PNG files. It does not execute quality control, SCTransform, PCA, integration, marker identification or SpaCET. The report has intentionally not been rendered as part of its creation.