Results
Sample-level quality control
The notebook reports 2,582 initial spots and 2,517 retained spots after applying the existing criteria of more than 200 detected genes and less than 10% mitochondrial transcripts. Most excluded spots were documented in a restricted lower-tissue region associated with elevated mitochondrial signal. Genes detected in fewer than three retained spots were subsequently removed.
Observation. Quality metrics and excluded spots were spatially structured rather than uniformly distributed.
Interpretation. Local low-complexity or high-mitochondrial signal may reflect technical degradation, local tissue condition or both; the QC metrics do not establish the cause.
The notebook reports 2,216 initial spots. It states that one spot met the low-feature exclusion criterion and that none exceeded the 10% mitochondrial threshold. Low-feature candidates were mainly located near tissue boundaries.
Observation. The selected thresholds had a minimal effect on retained spots in this section.
Verification note. The notebook’s inline QC text refers to an apparently undefined dim_after_qc object. The stated retained-spot count should be confirmed before publication.
No standalone QC figures are currently saved in results/figures/. The QC maps remain embedded in the sample notebooks and are not recreated here.
Spatial clustering
Resolution 0.6 was selected as the working clustering solution. Marker-guided assessment described mixed spatial domains associated with immune, epithelial, stromal, hypoxic, inflammatory, interferon-responsive and proliferative programs.
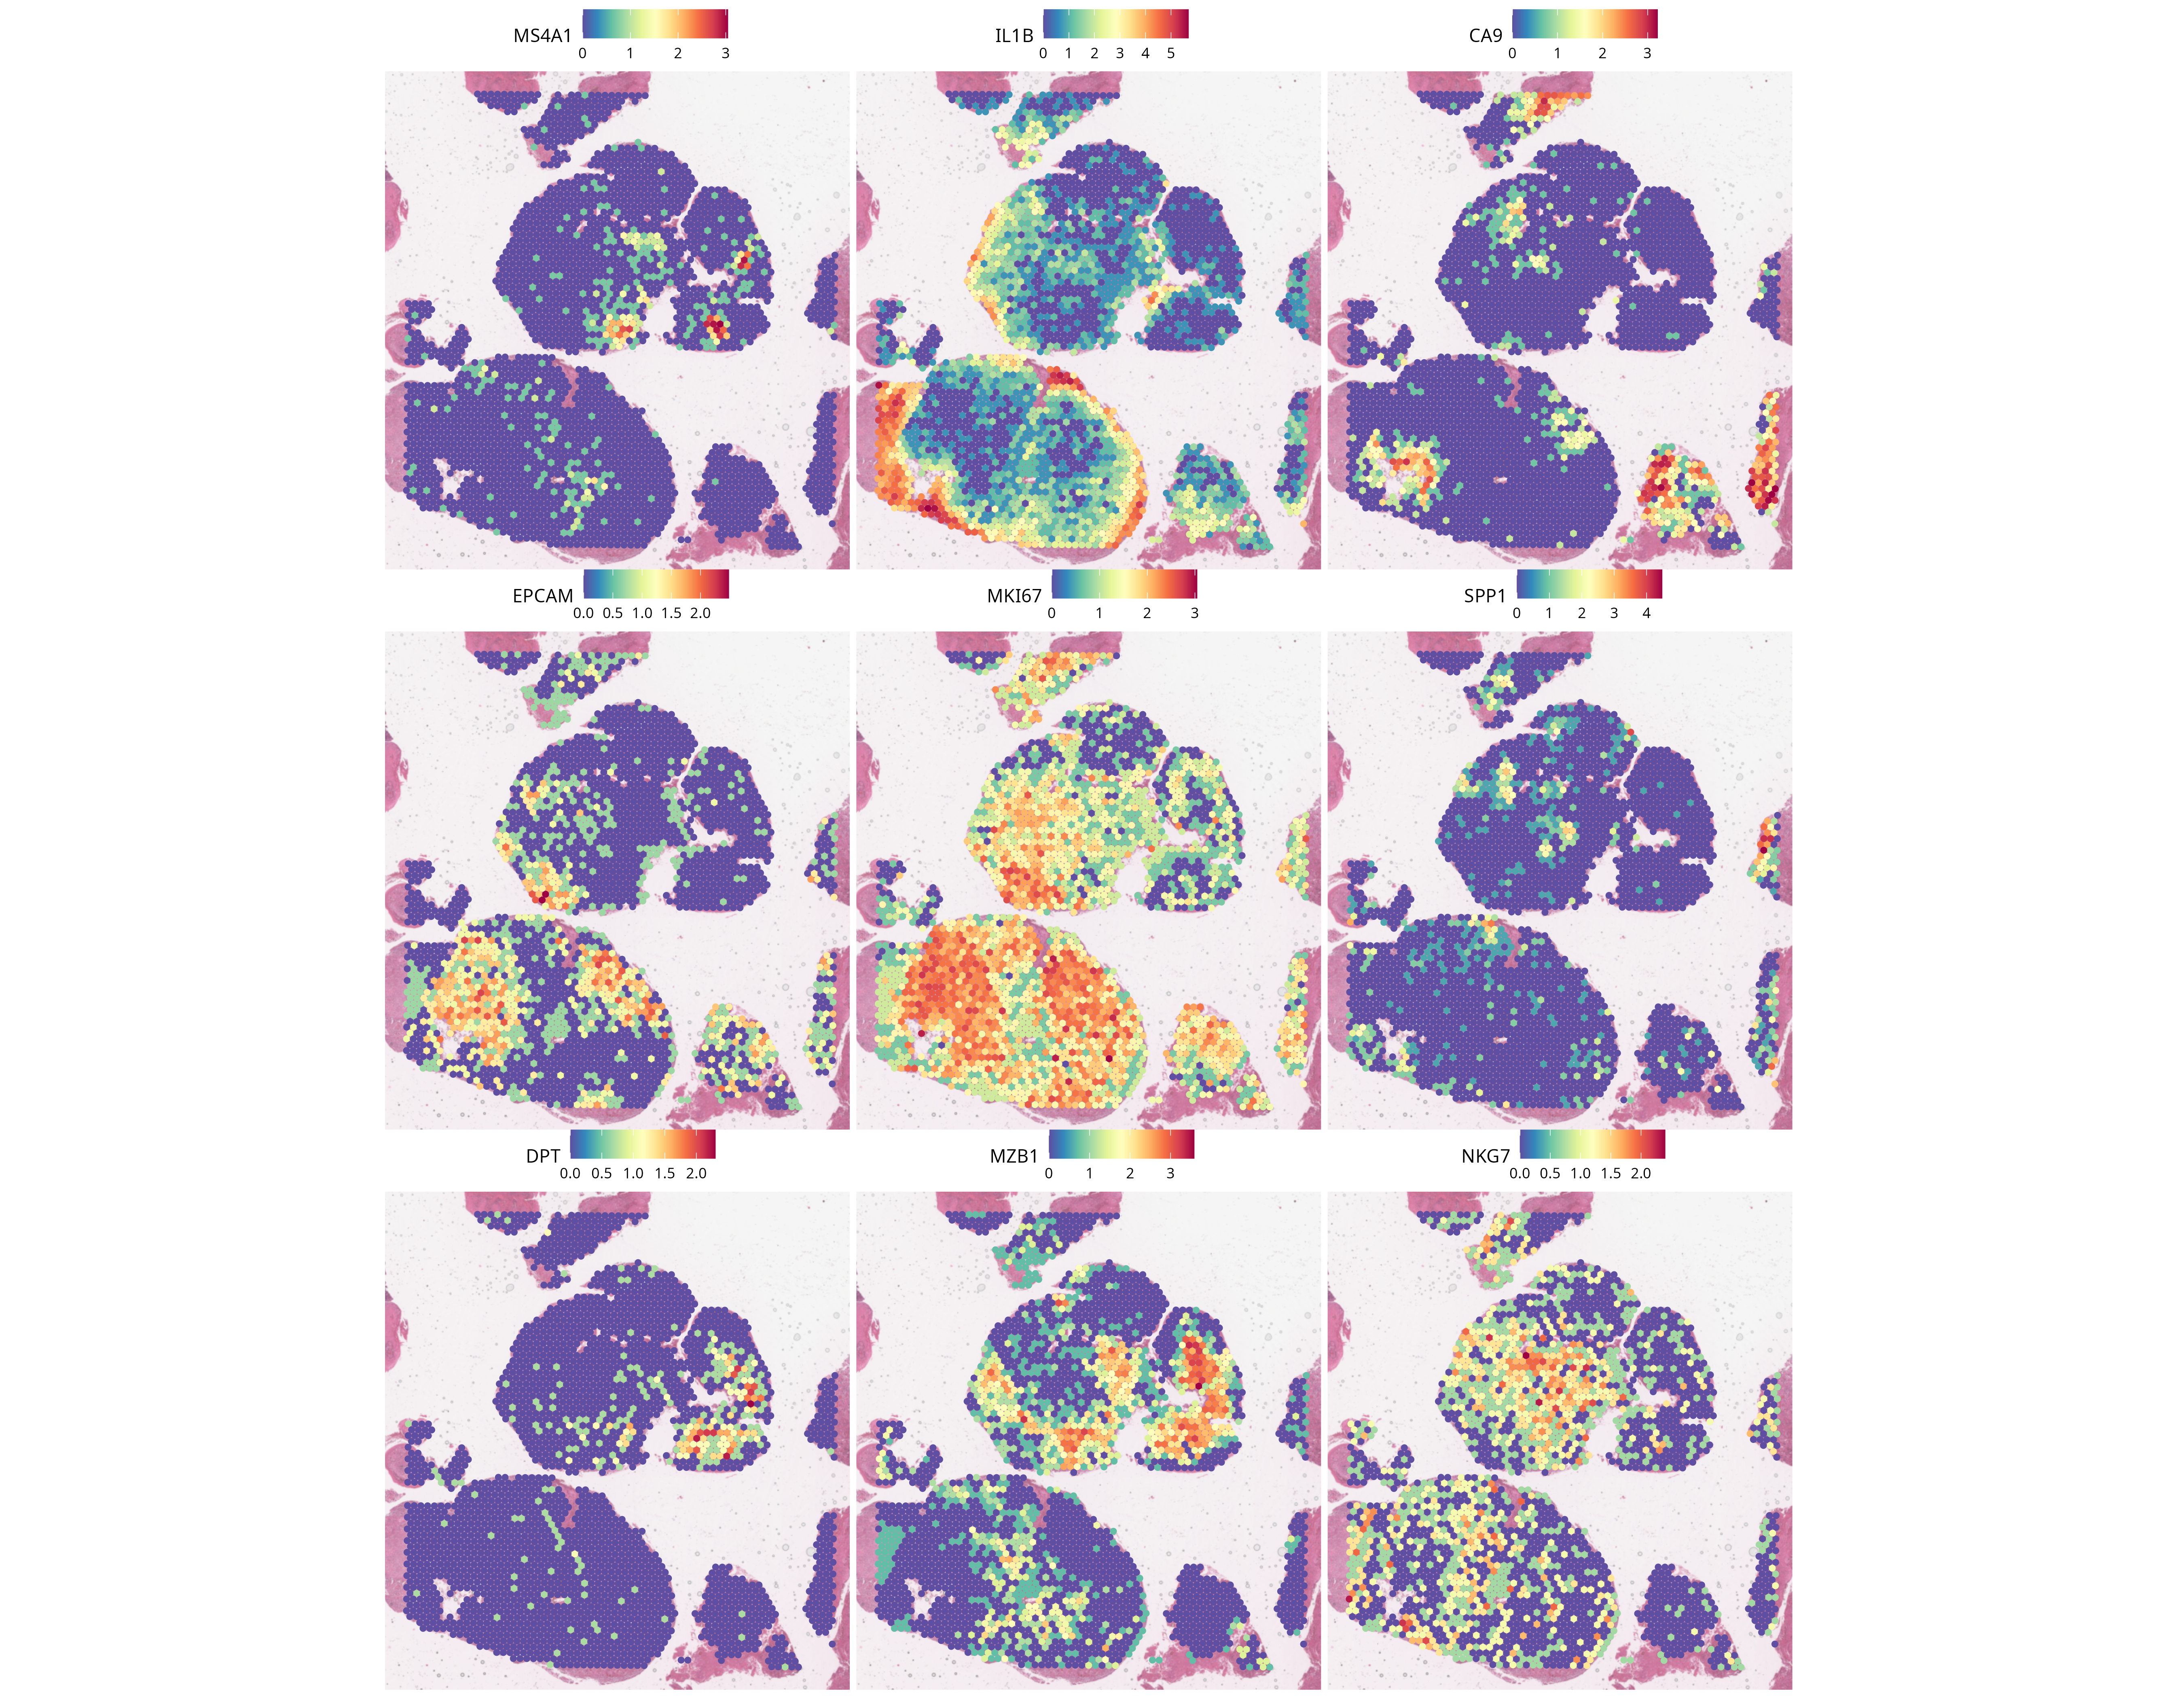
Observation. Several marker programs form localized patterns in the tissue section.
Interpretation. Spatial localization complements the transcriptomic clustering because coordinates were not used to construct the expression graph. It does not establish pure cell identity or direct cellular interaction.
Resolution 0.8 was selected after comparison with resolution 0.6. The notebook reports that the finer solution primarily subdivided two clusters and that the resulting groups showed distinct marker profiles.
No standalone 19H1257 clustering or marker figure is available in results/figures/; no substitute image is generated.
RPCA integration
The sample-specific objects were merged, represented with a joint PCA and integrated with reciprocal PCA. Integrated resolution-0.6 clusters were used for marker assessment and spatial projection.
Observation. The cross-sample notebook reports that most integrated clusters contained spots from both samples, while several clusters were enriched in one section. Integrated labels also formed structured domains in tissue space.
Interpretation. Shared clusters are consistent with recurrent transcriptional programs. Sample-enriched clusters may reflect biological heterogeneity, sampled tissue composition, technical variation or incomplete integration.
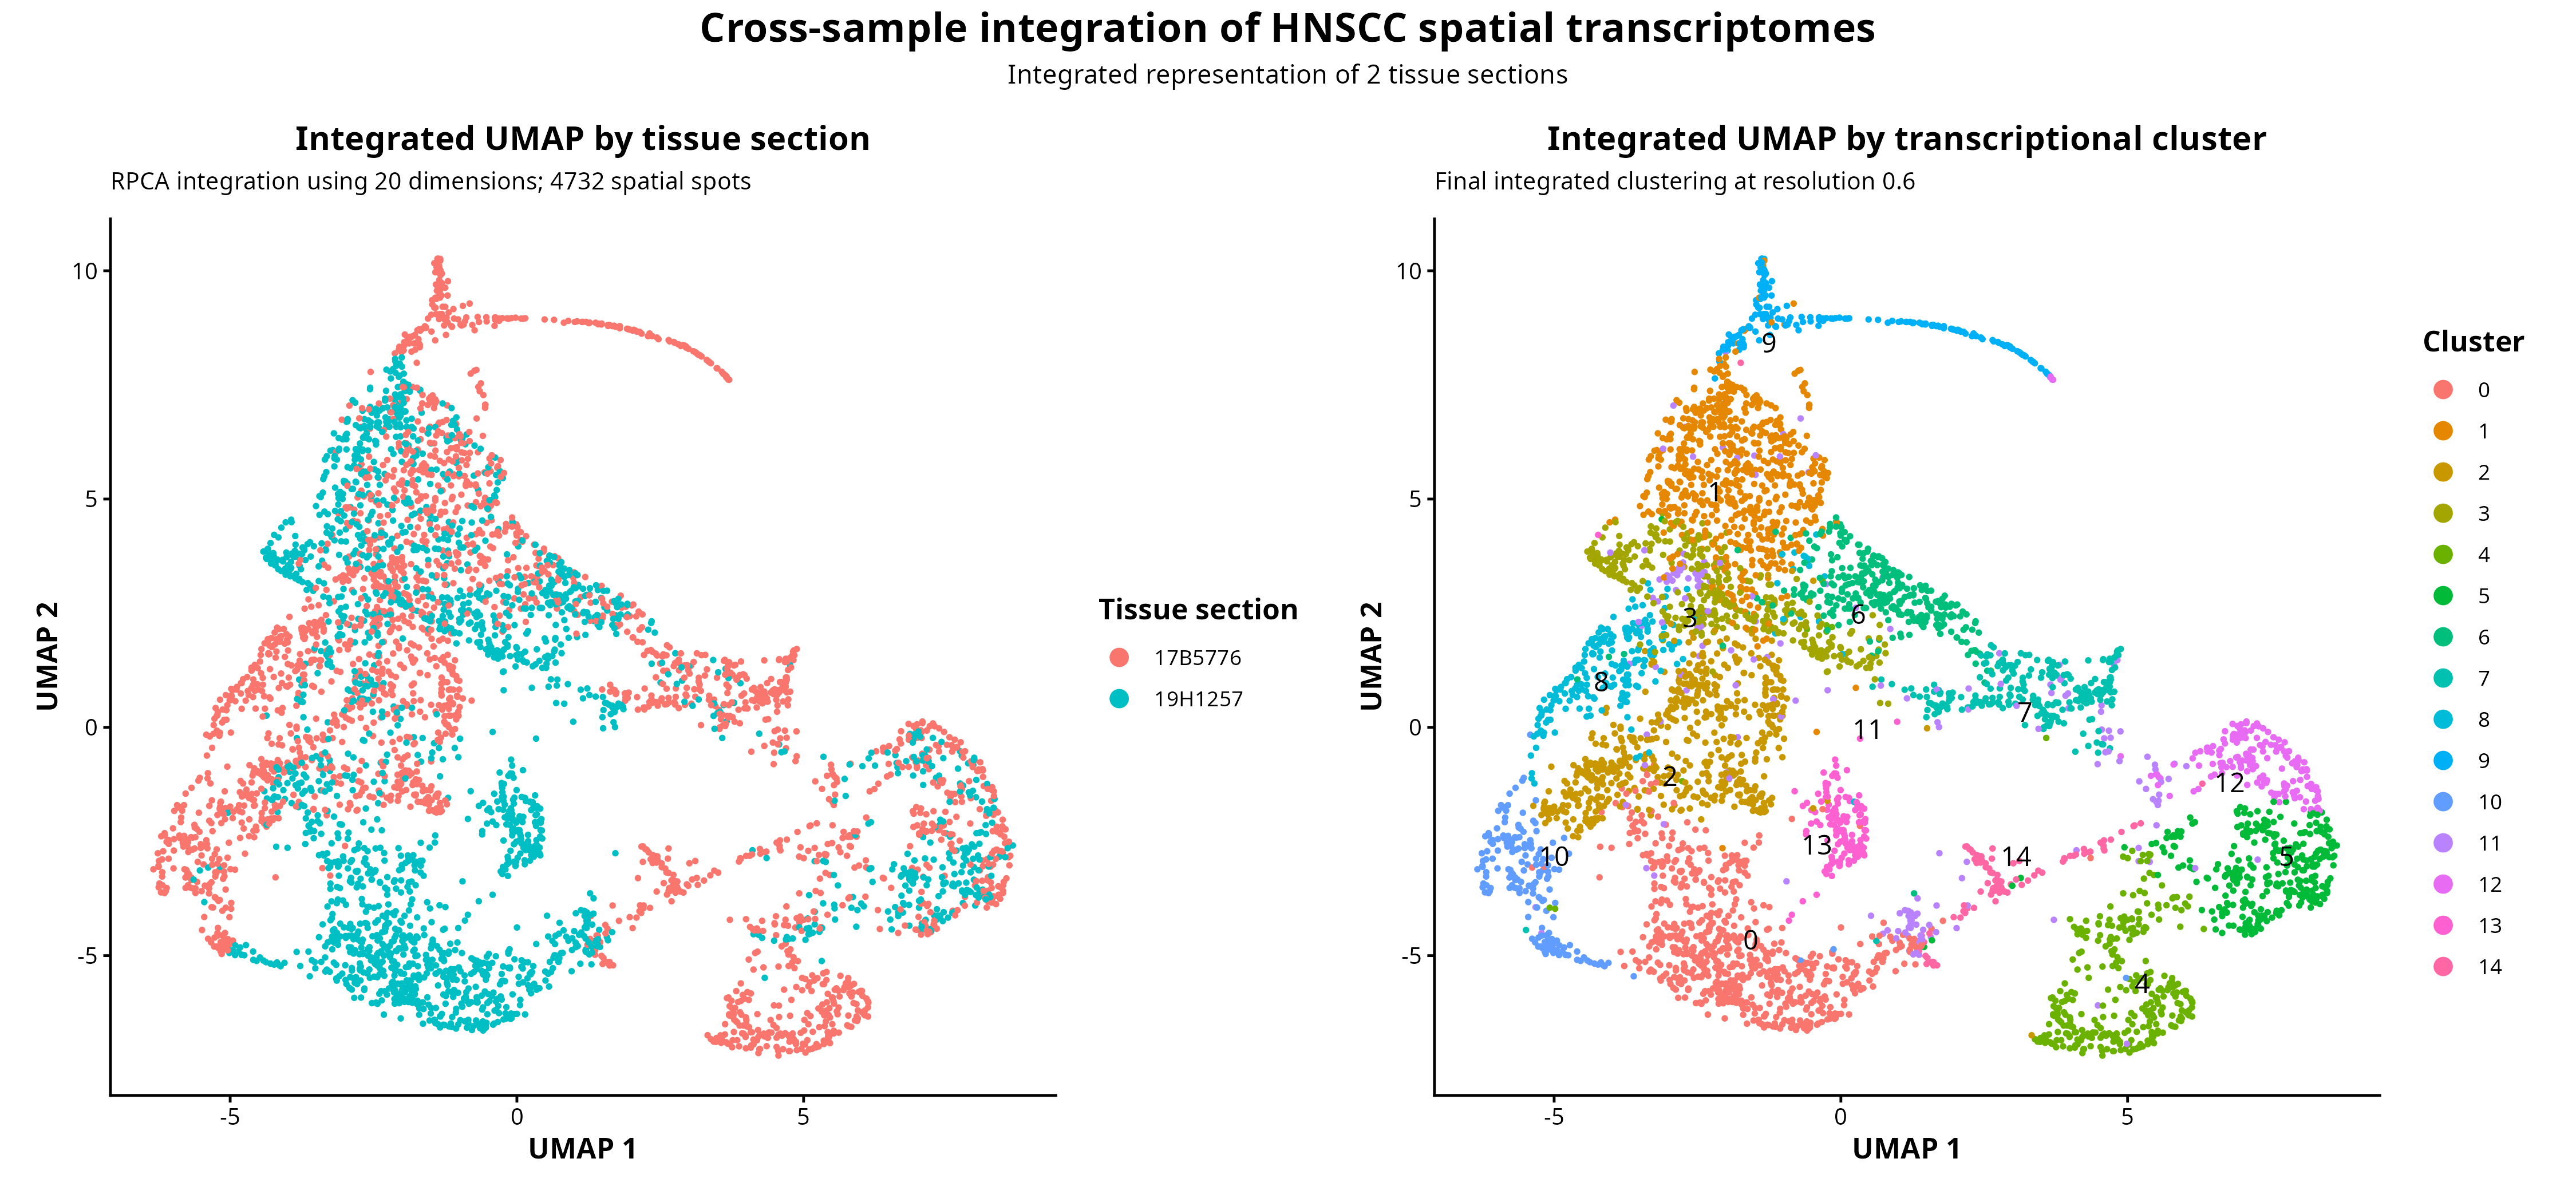
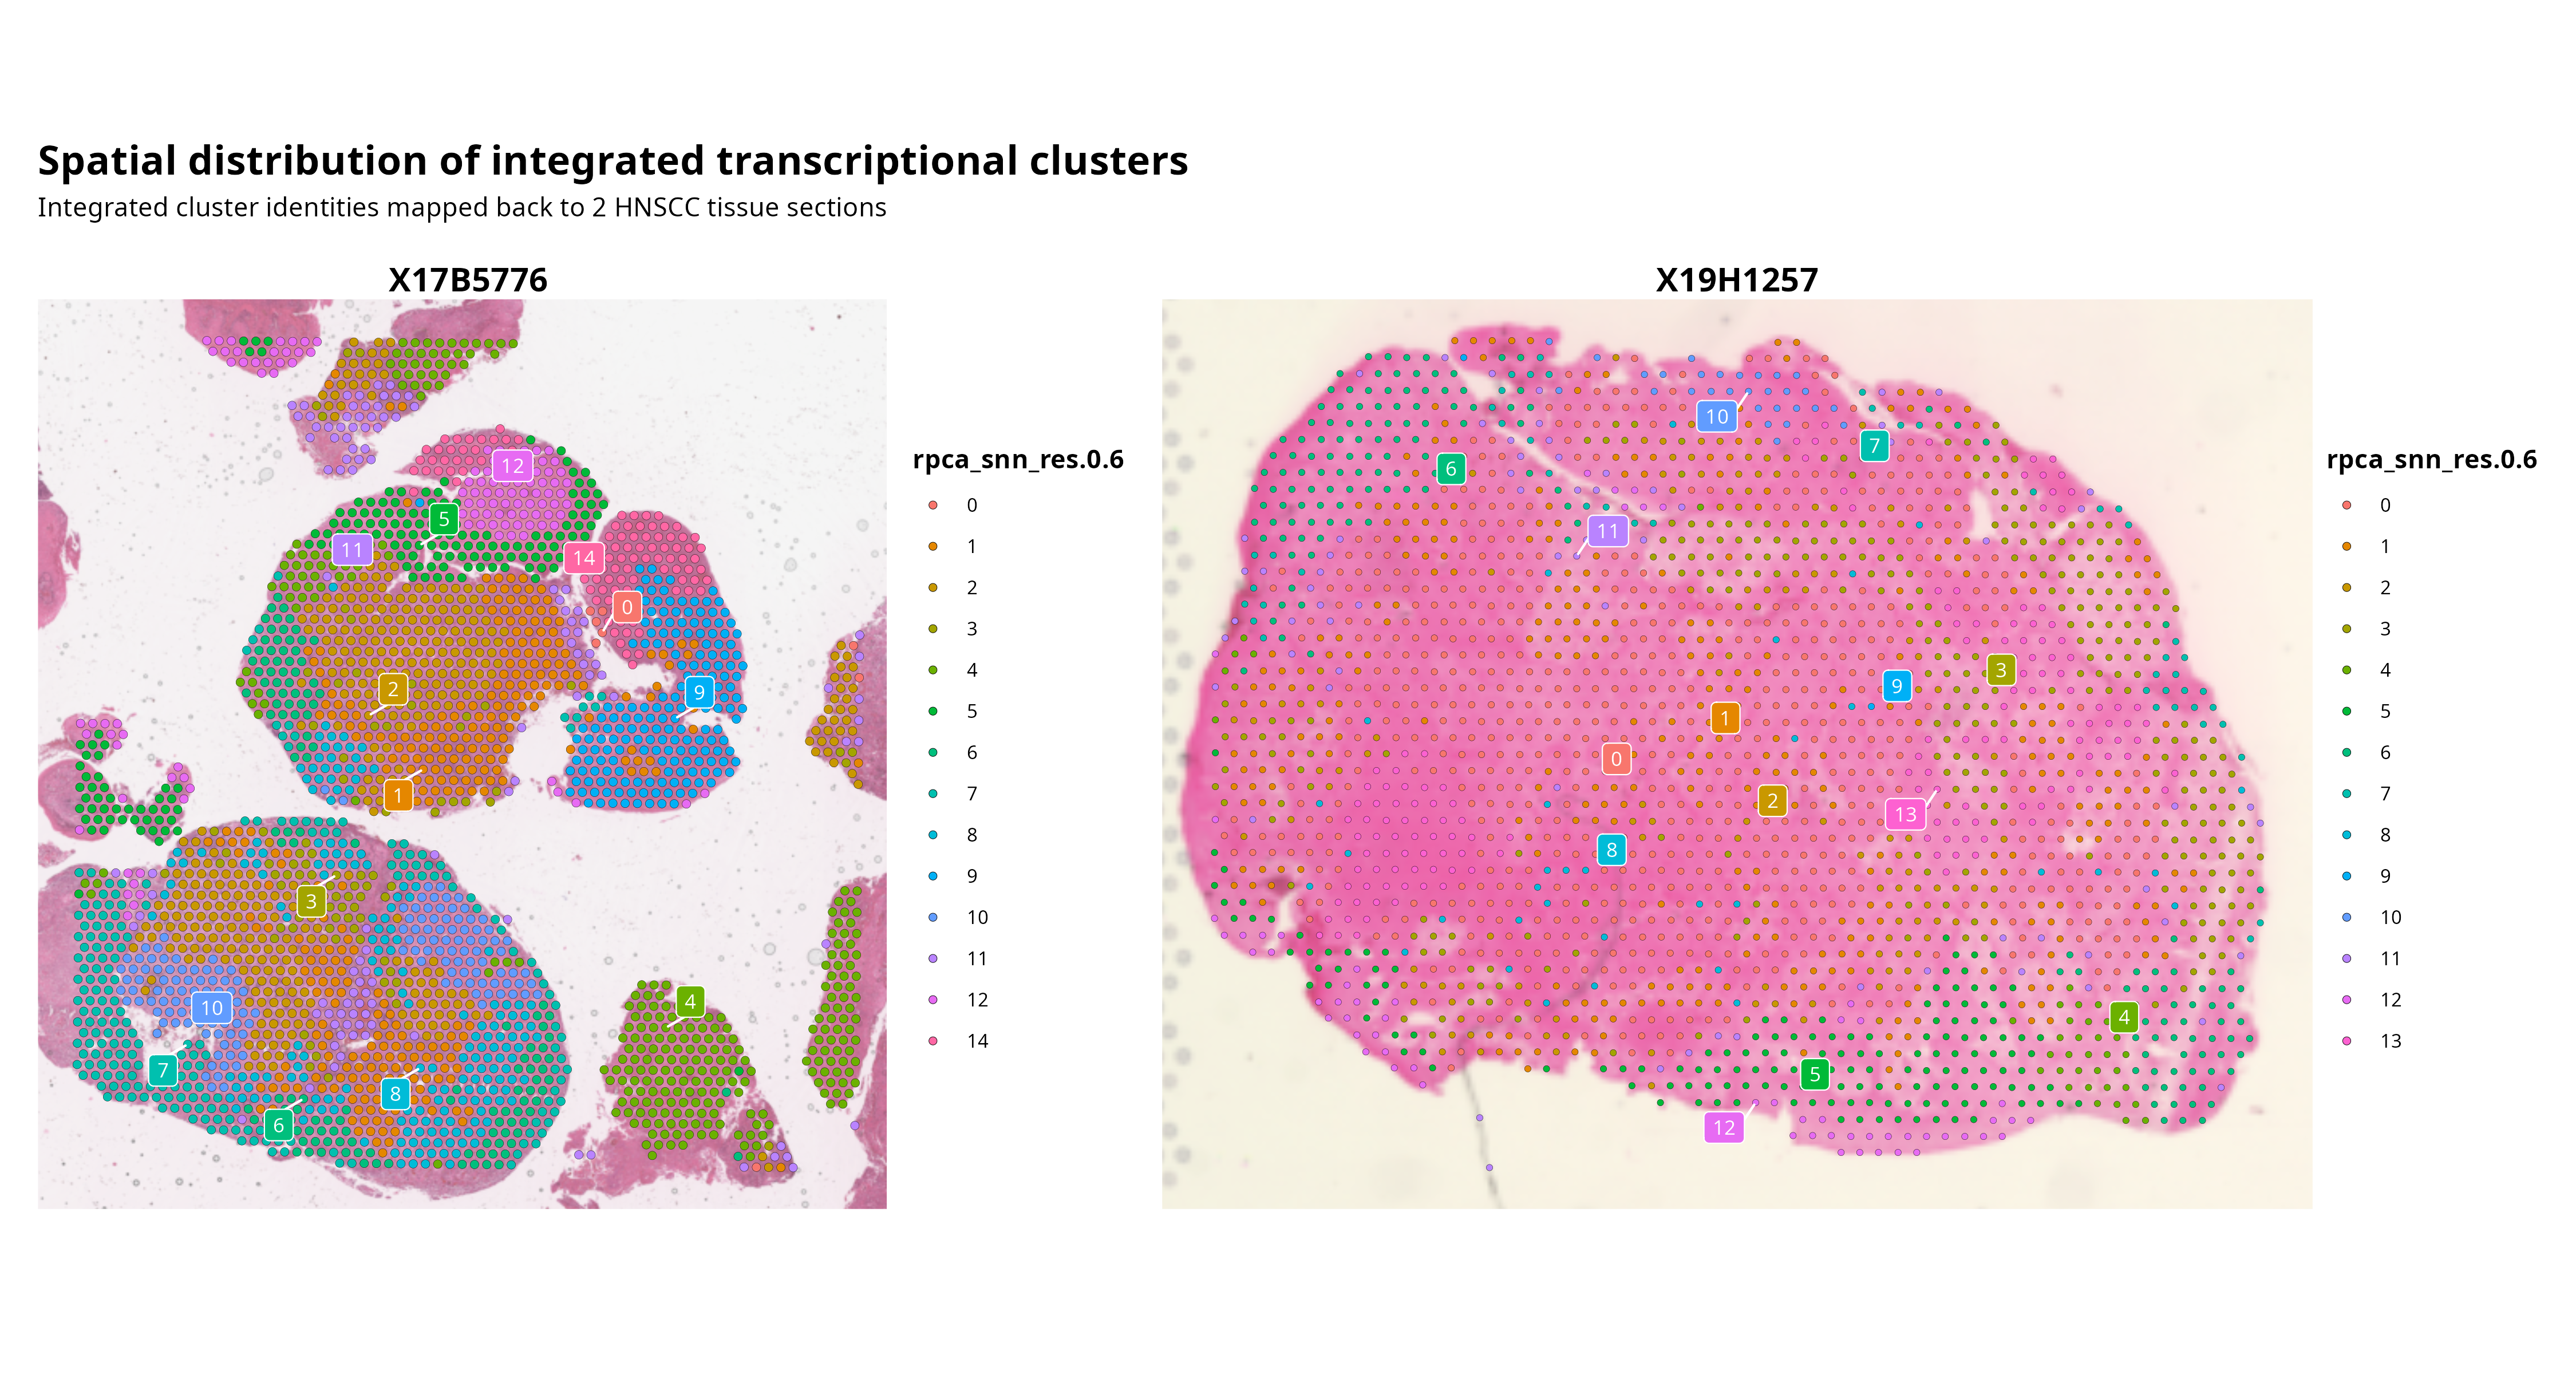
RPCA integration can retain technical differences or attenuate genuine sample-specific biology. Visual mixing in the integrated UMAP is not sufficient evidence of complete batch-effect removal.
Download all integrated-cluster markers Download the top-five marker table
SpaCET deconvolution
SpaCET was run independently for each section with the HNSC cancer model. Major malignant, stromal and immune lineage estimates were extracted into a combined spot-level table. Major and subordinate hierarchy levels were not added together because they overlap and would be double-counted.
1. Spatial counts
Raw Visium gene-expression counts were processed independently for each tissue section.
→
2. SpaCET deconvolution
The HNSC cancer model was used to estimate malignant, stromal and immune transcriptional contributions for every spatial spot.
→
3. Spatial niches
Estimated fractions were summarized and mapped to identify immune-rich and immune-low tissue regions.
SpaCET fractions are estimated transcriptional contributions, not exact cell counts. A larger fraction does not directly imply a corresponding number of cells.
Major cell fraction comparison
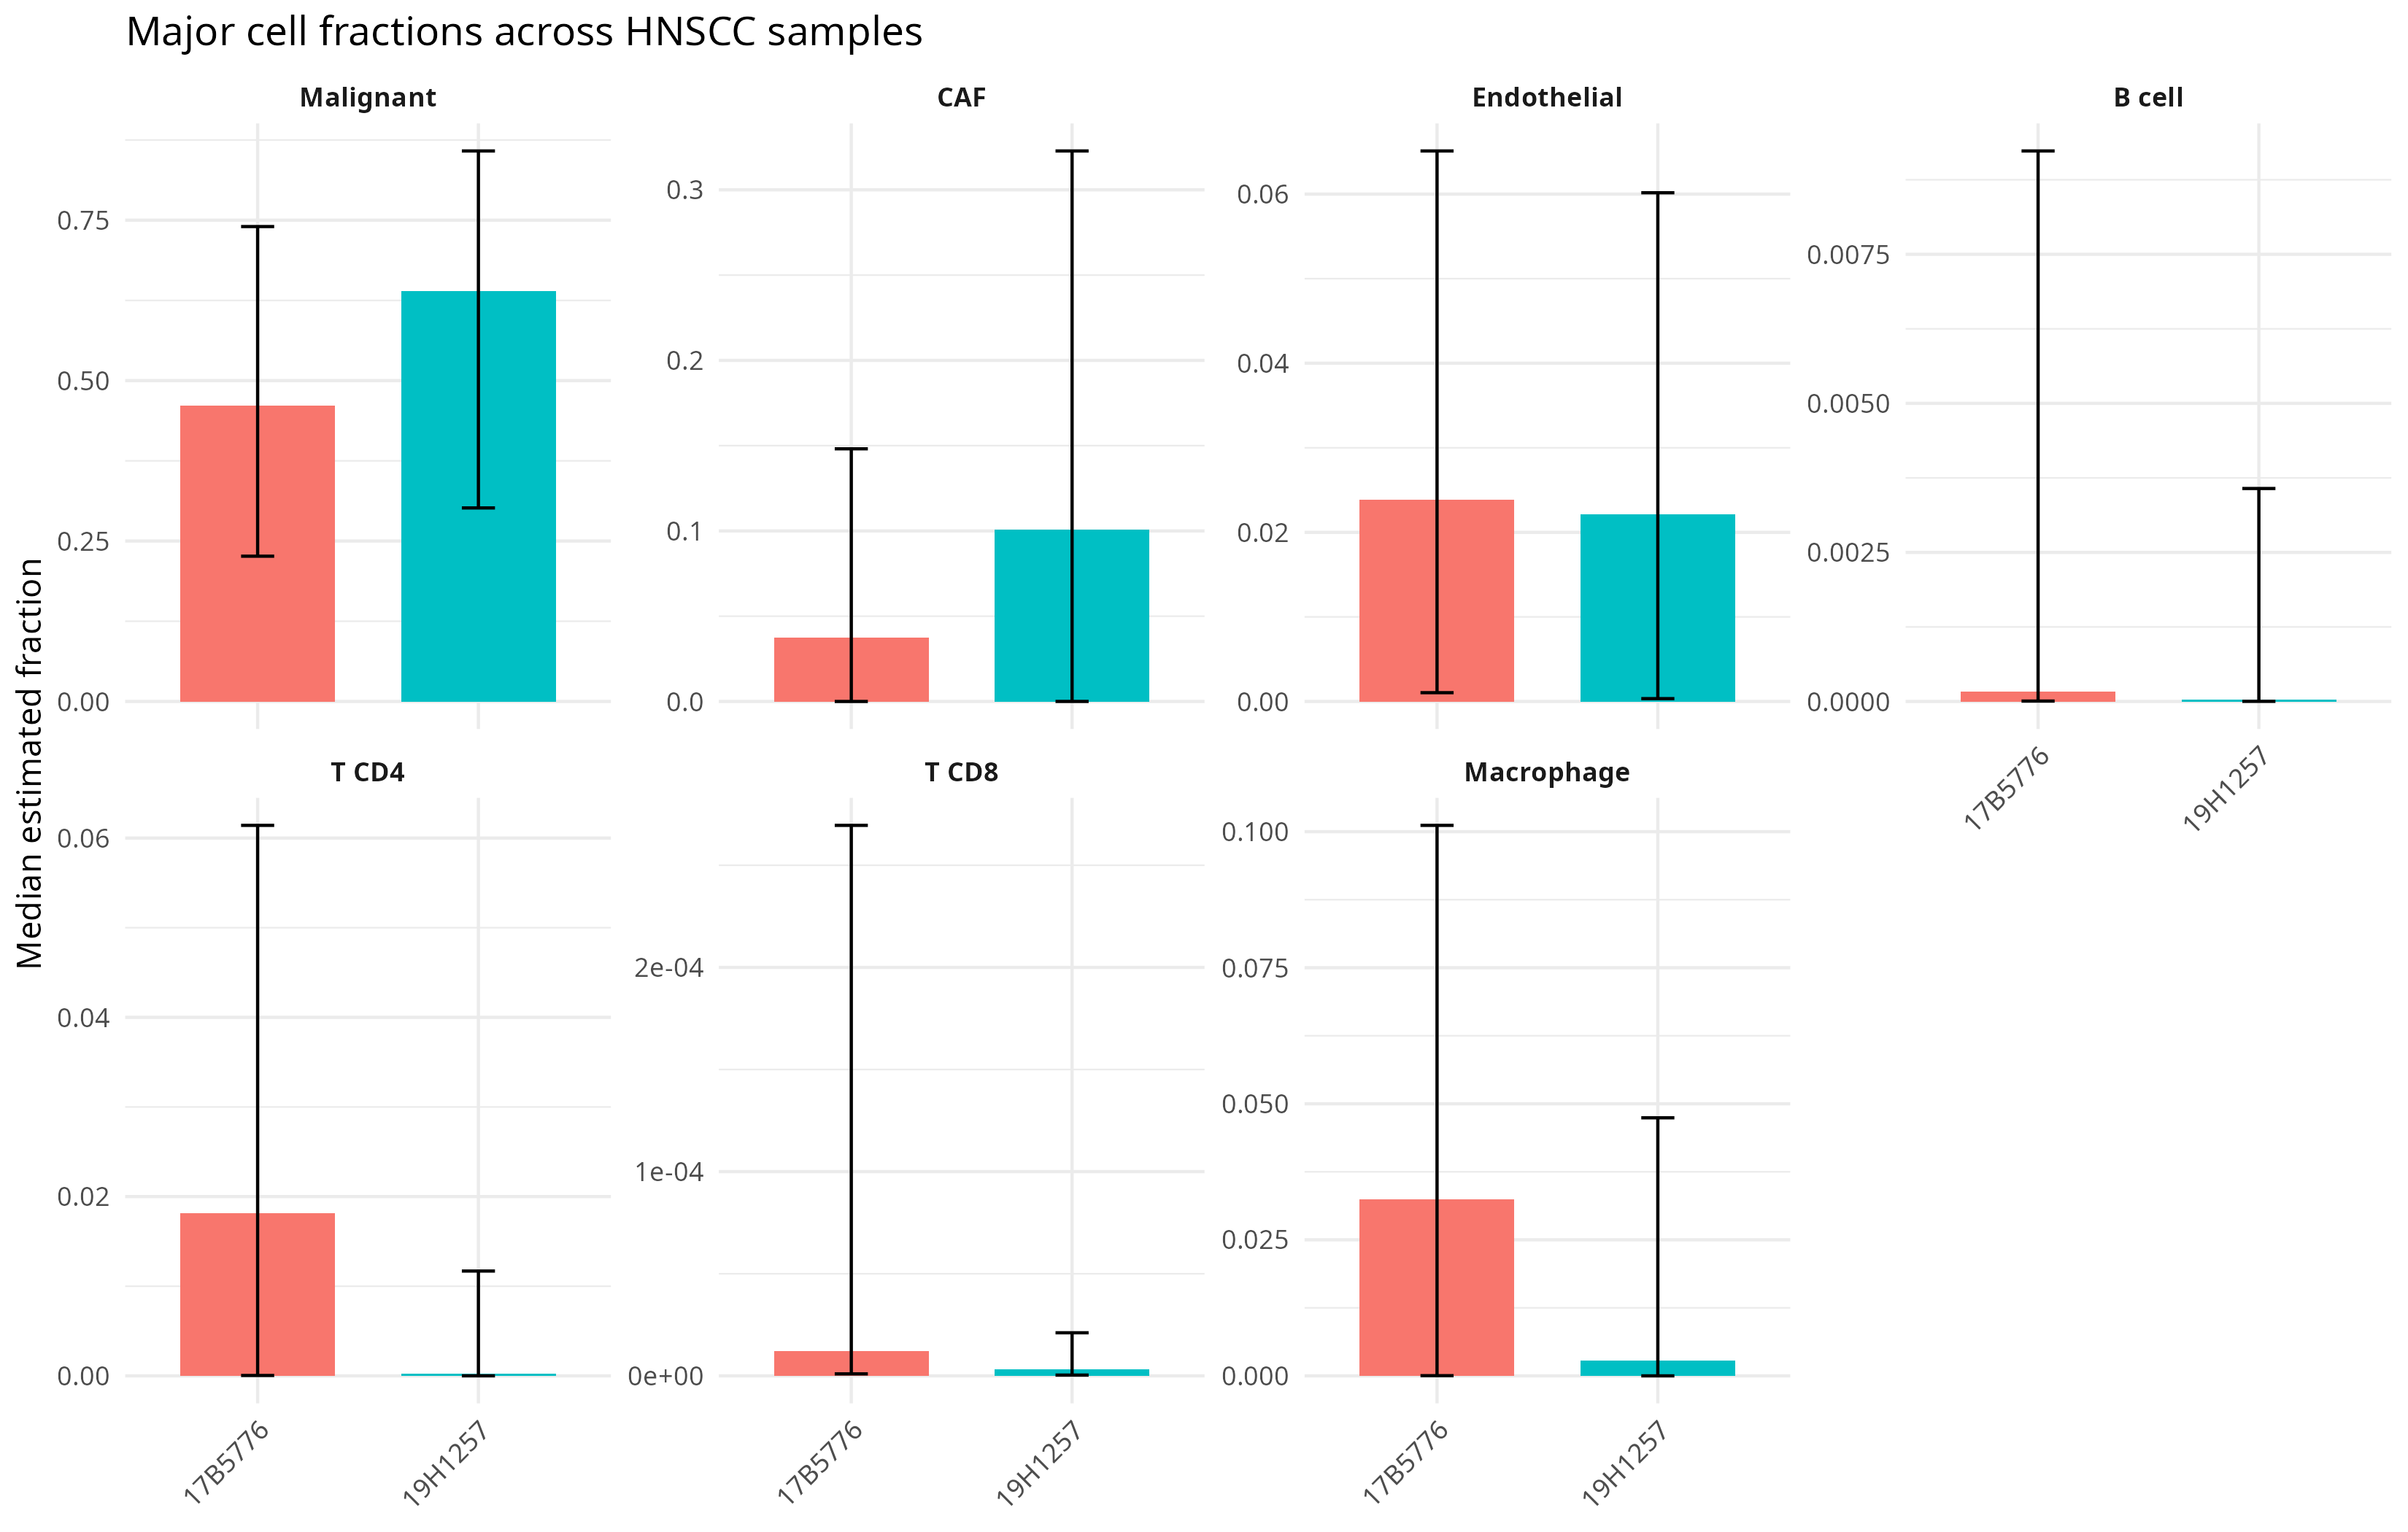
Observation. The saved summary shows a higher median estimated malignant fraction and a higher median CAF fraction in 19H1257 than in 17B5776. Median endothelial estimates are similar in magnitude.
Interpretation. These differences describe the two tissue sections and may reflect tissue composition, spatial sampling or model behavior. They are not population-level HNSCC effects.
Immune-fraction distributions
The derived total immune fraction sums only the major immune lineage estimates: Plasma, B cell, T CD4, T CD8, NK, cDC, pDC, Macrophage, Mast and Neutrophil.
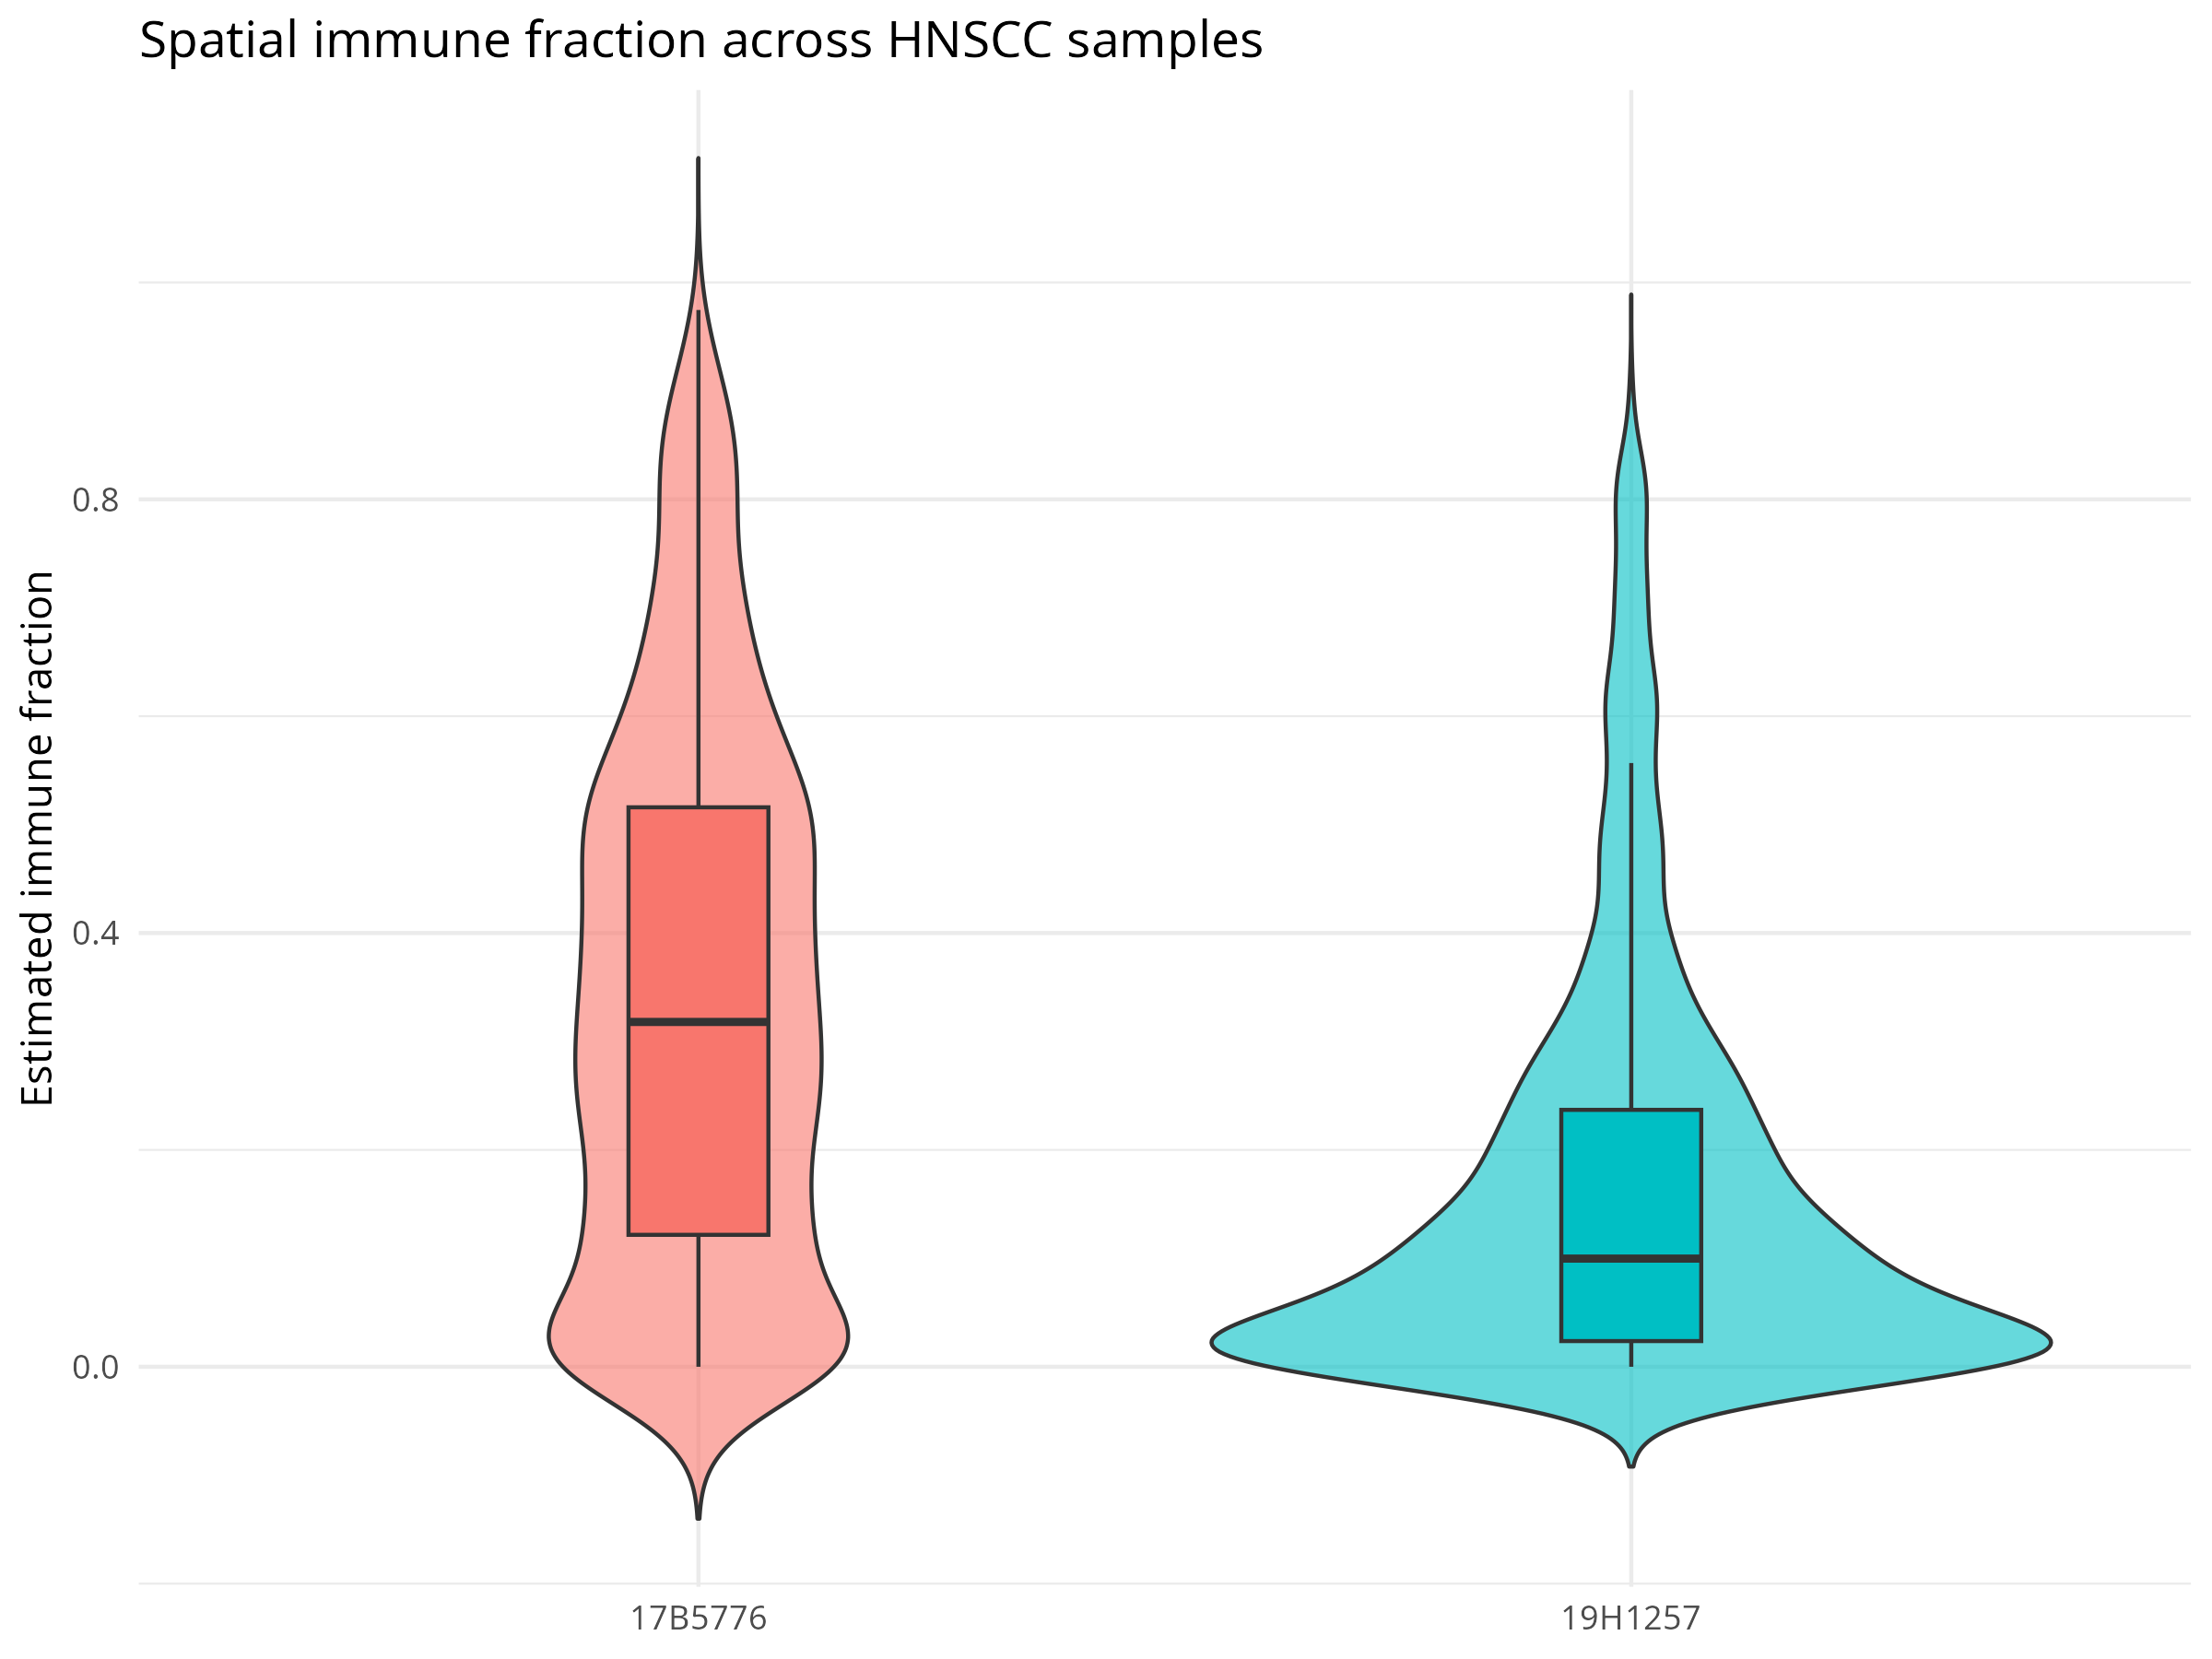
Observation. The saved summary reports a median derived immune fraction of 0.318 in 17B5776 and 0.100 in 19H1257 after rounding to three decimals.
Interpretation. The distributions show within-section heterogeneity. Spots are spatially related and must not be treated as independent patient measurements.
Spatial immune niches
Immune-low, Intermediate and Immune-high categories were defined independently in each sample. Spots at or below the sample-specific first quartile were labelled Immune-low, spots at or above the third quartile were labelled Immune-high, and all remaining spots were labelled Intermediate.
An Immune-high spot in one sample is not necessarily equivalent in absolute immune fraction to an Immune-high spot in the other sample.
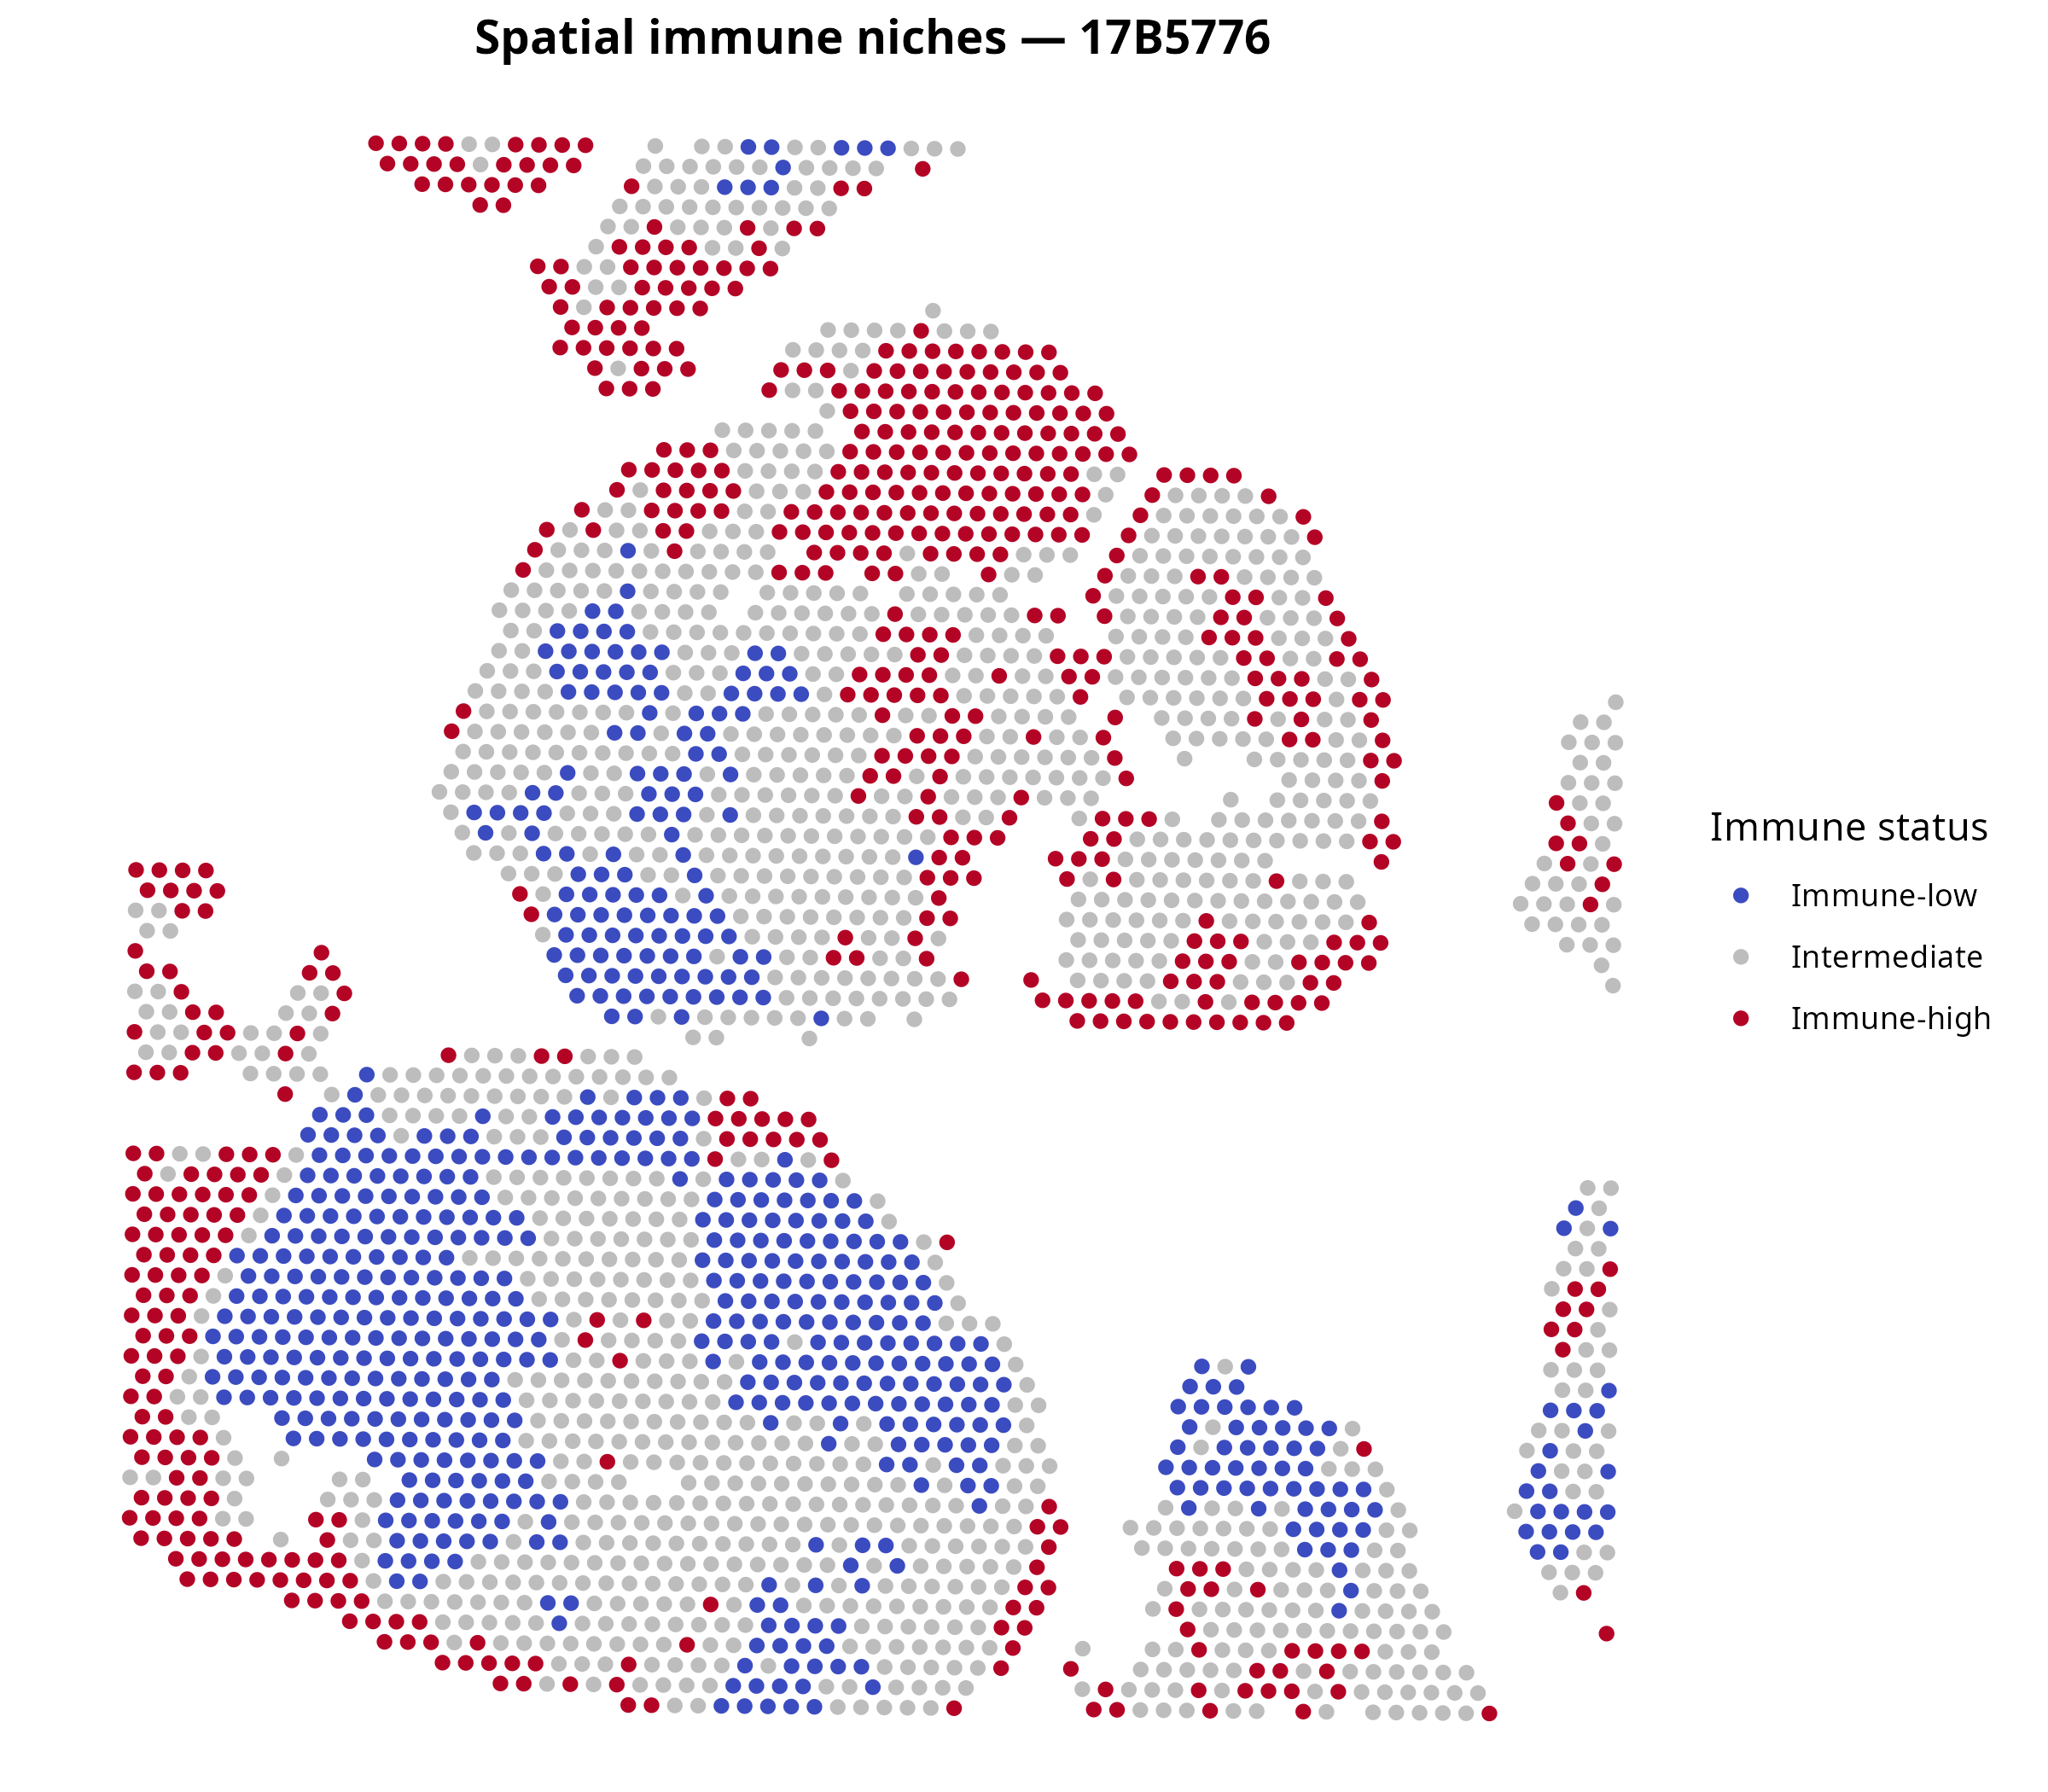
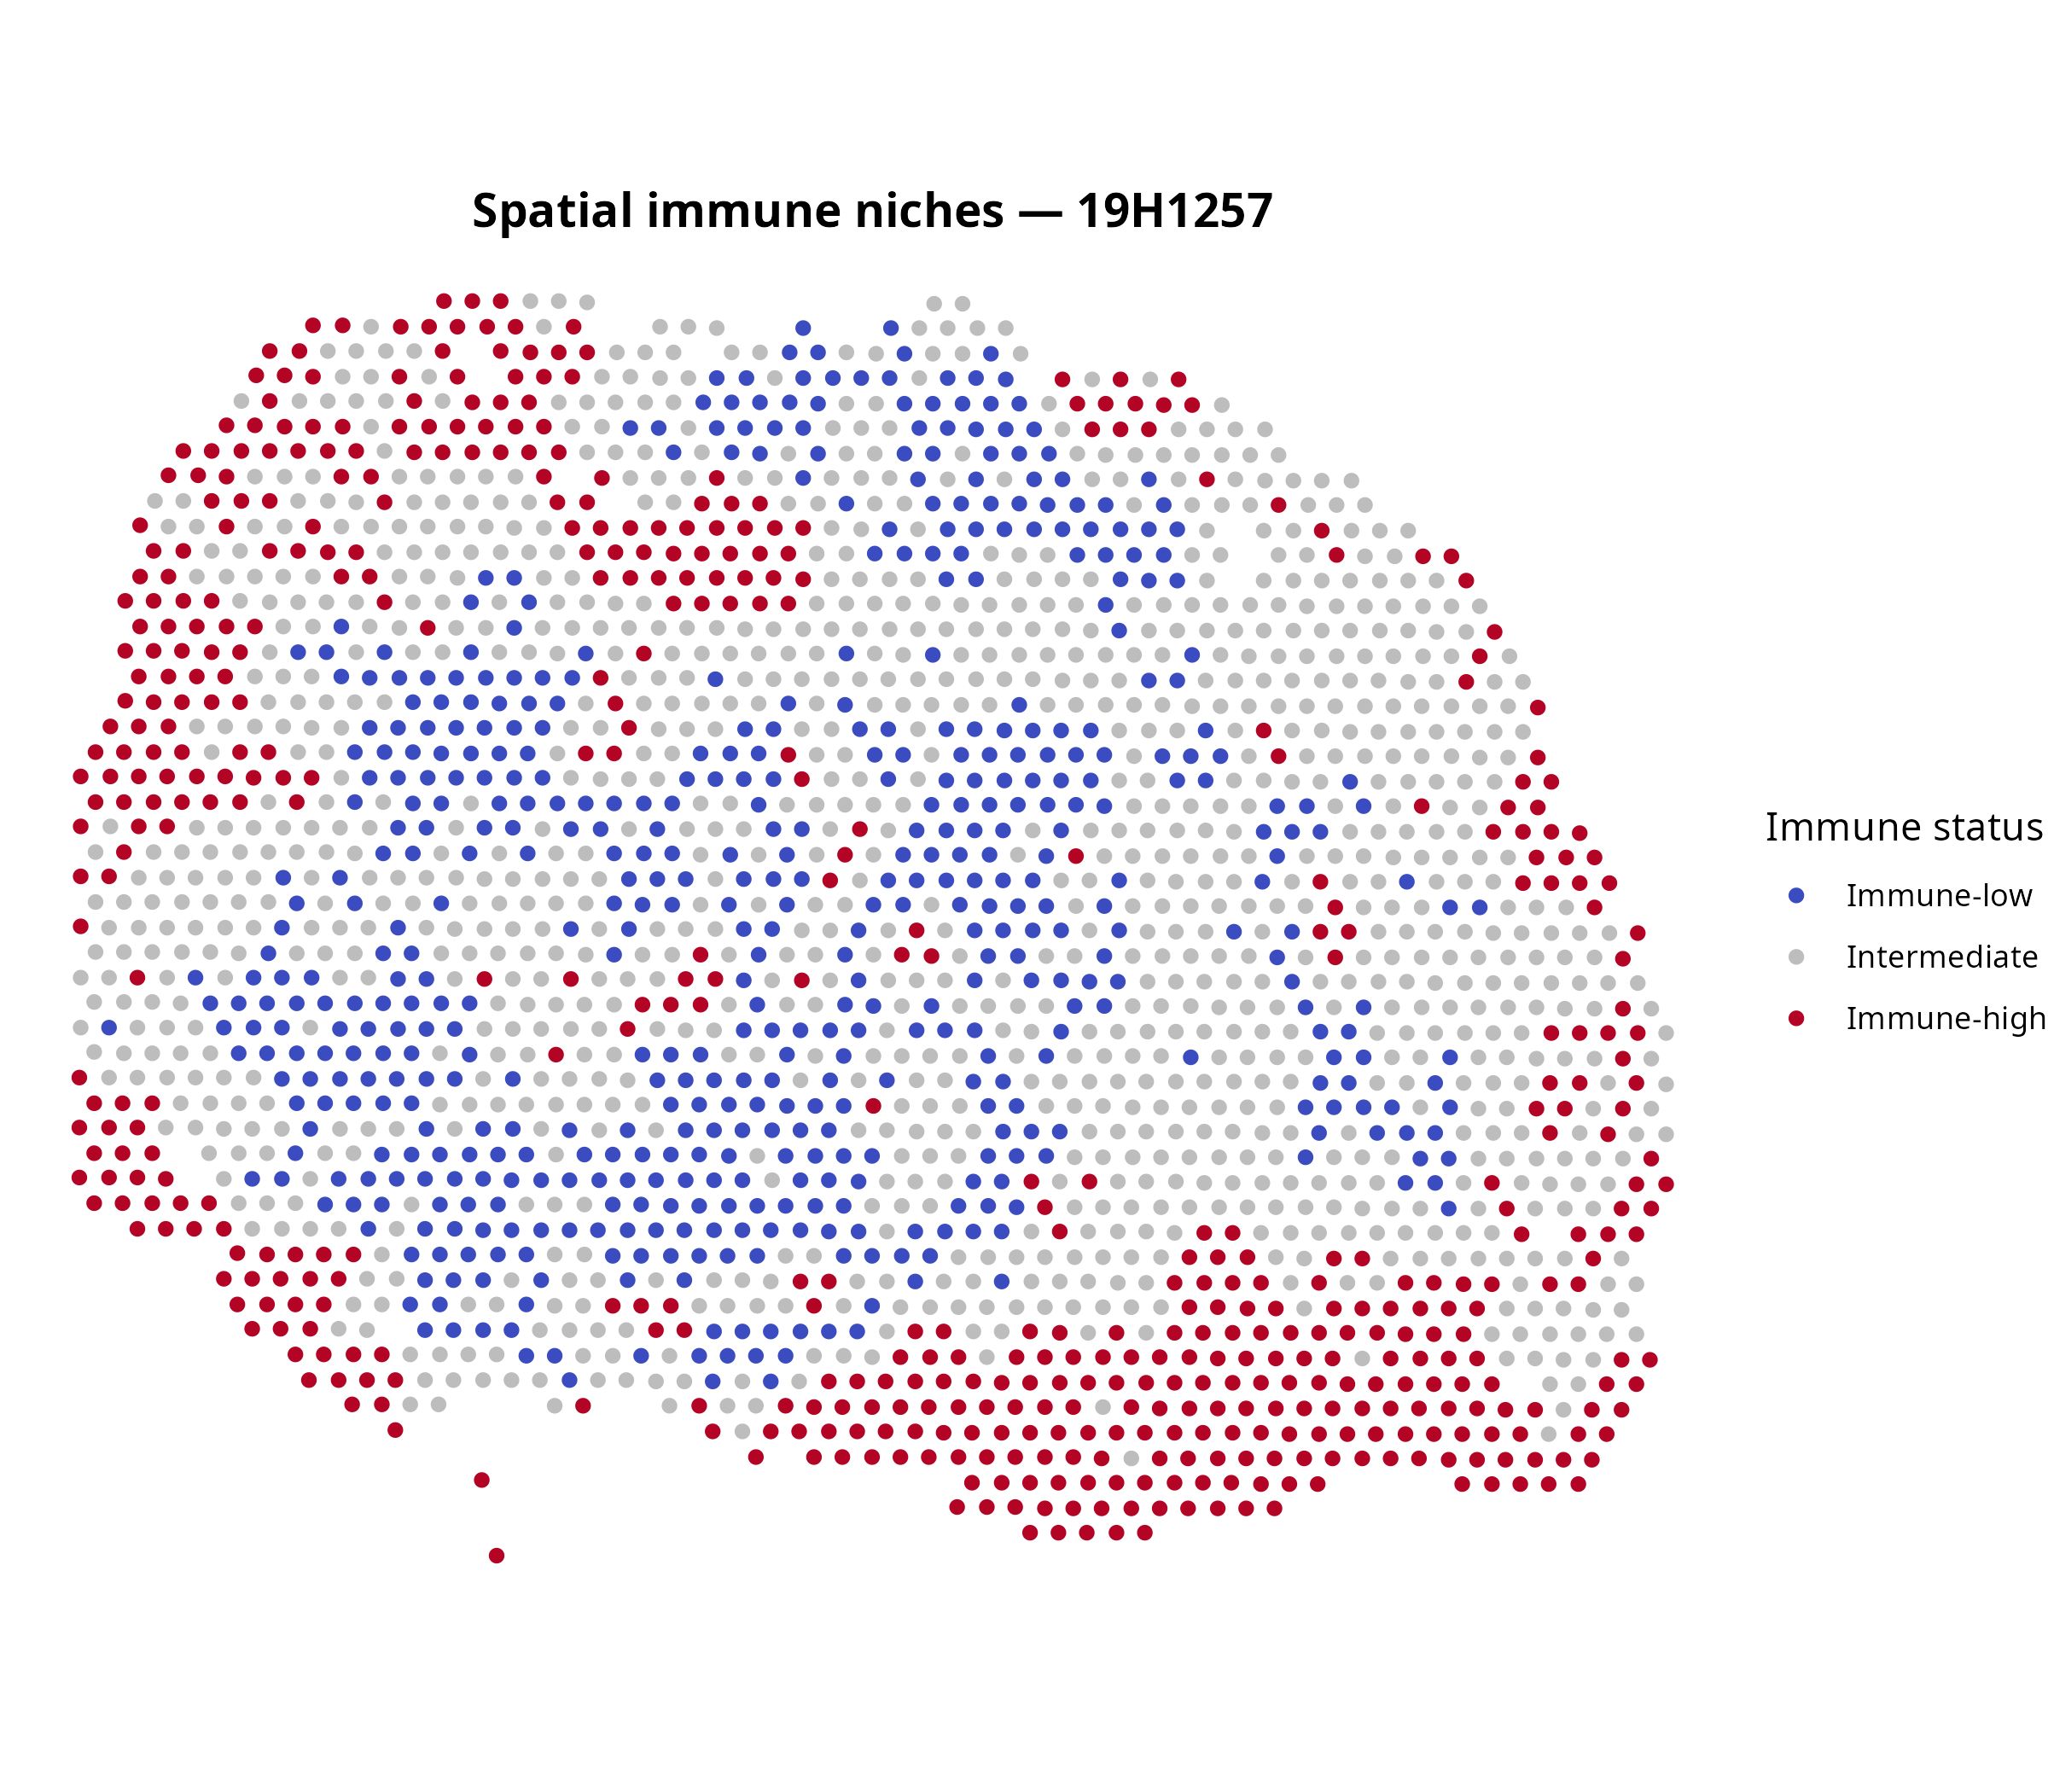
Observation. The three relative categories are spatially distributed within each section rather than summarized by one section-wide value.
Hypothesis. Local aggregation could reflect heterogeneous immune microenvironments. Testing that hypothesis requires additional samples, histological validation and replicated spatial inference.
Composition of Immune-high niches
Within each Immune-high spot, every major immune-lineage fraction was divided by the total immune fraction. The resulting shares were averaged separately by sample.
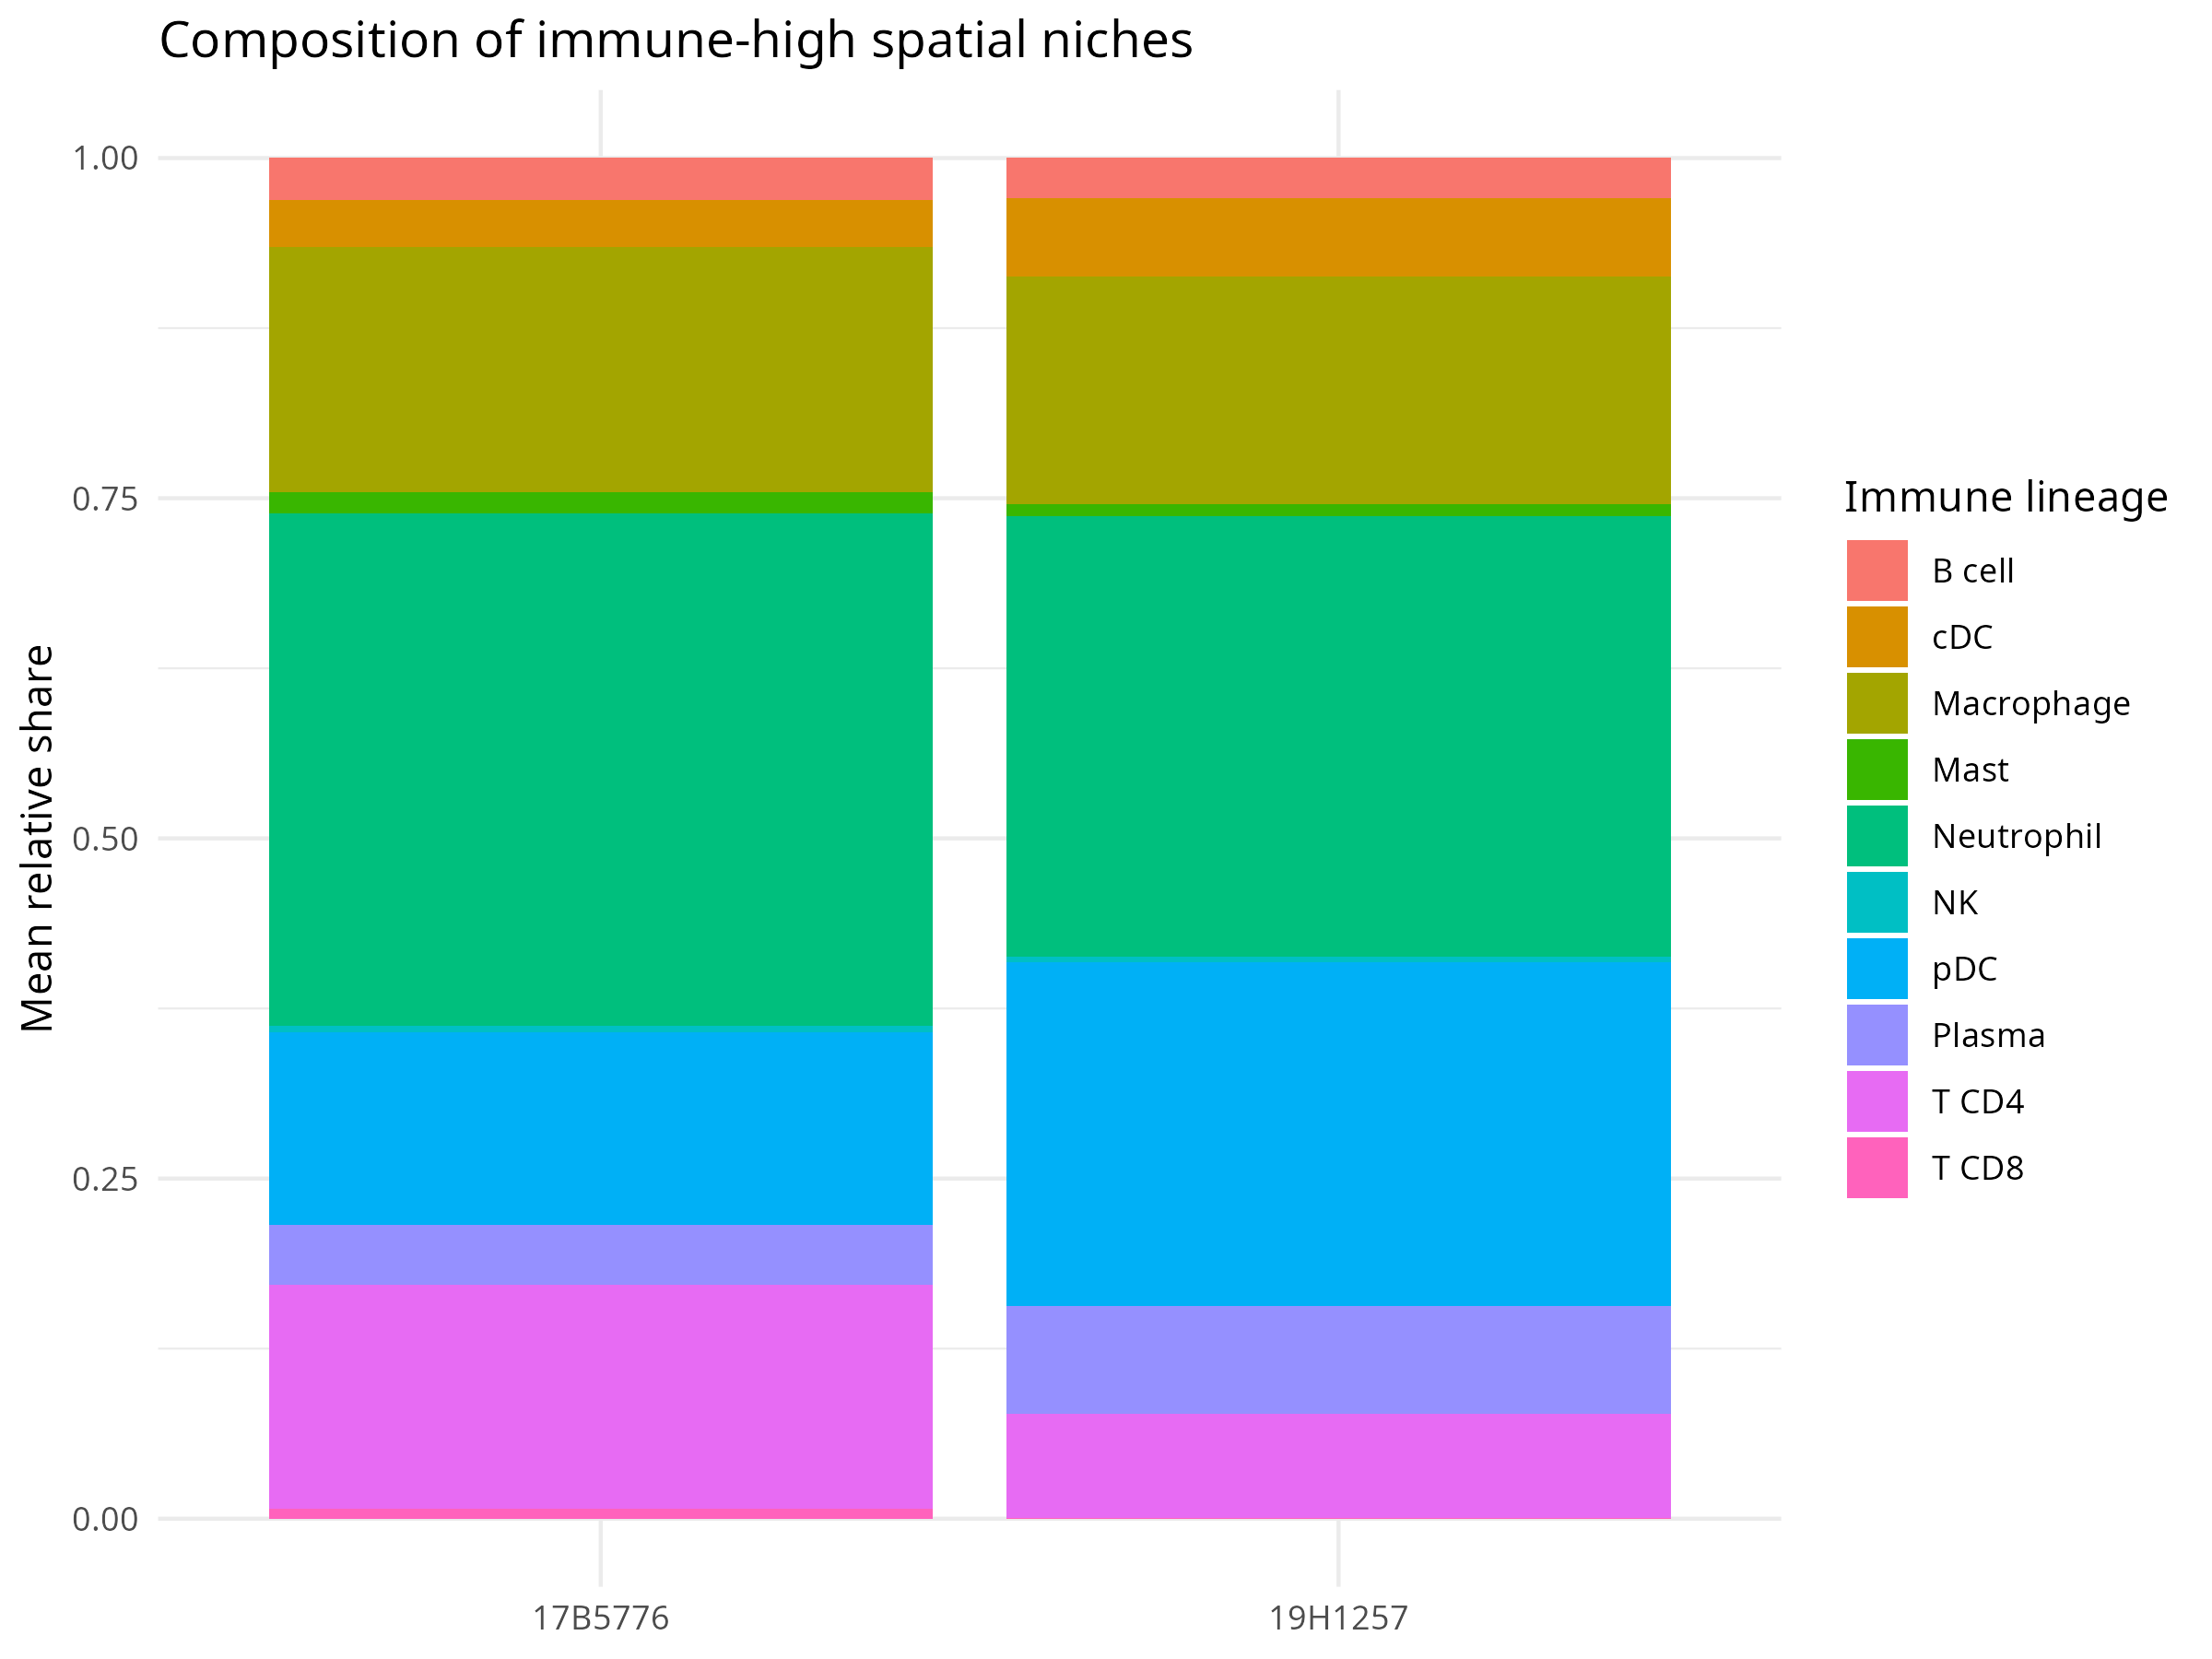
Observation. Neutrophils have the largest mean relative share in both saved sample summaries. Macrophage, T CD4 and pDC signals also contribute materially in 17B5776; pDC and macrophage signals are the next largest shares in 19H1257.
Interpretation. Immune-high niches contain mixed lineage-associated signals. Relative shares do not represent absolute abundance or enrichment compared with Immune-low spots.
Download the Immune-high composition table
The current analysis maps estimated malignant fractions and evaluates marker-associated epithelial domains, but it does not formally characterize distinct malignant transcriptional states.